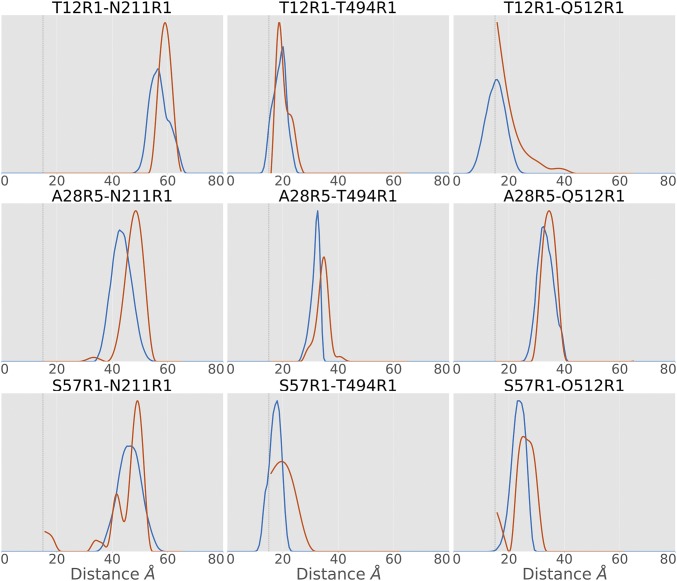
Fig. 3.
Comparison of predicted distance distributions (blue) with experimental DEER distance distributions (red). Most experimental distances are in good agreement with predicted distance distributions. All experimental results share a significant population in agreement with the predicted distance distribution. Gray dashed lines indicate the lower limit of DEER.

