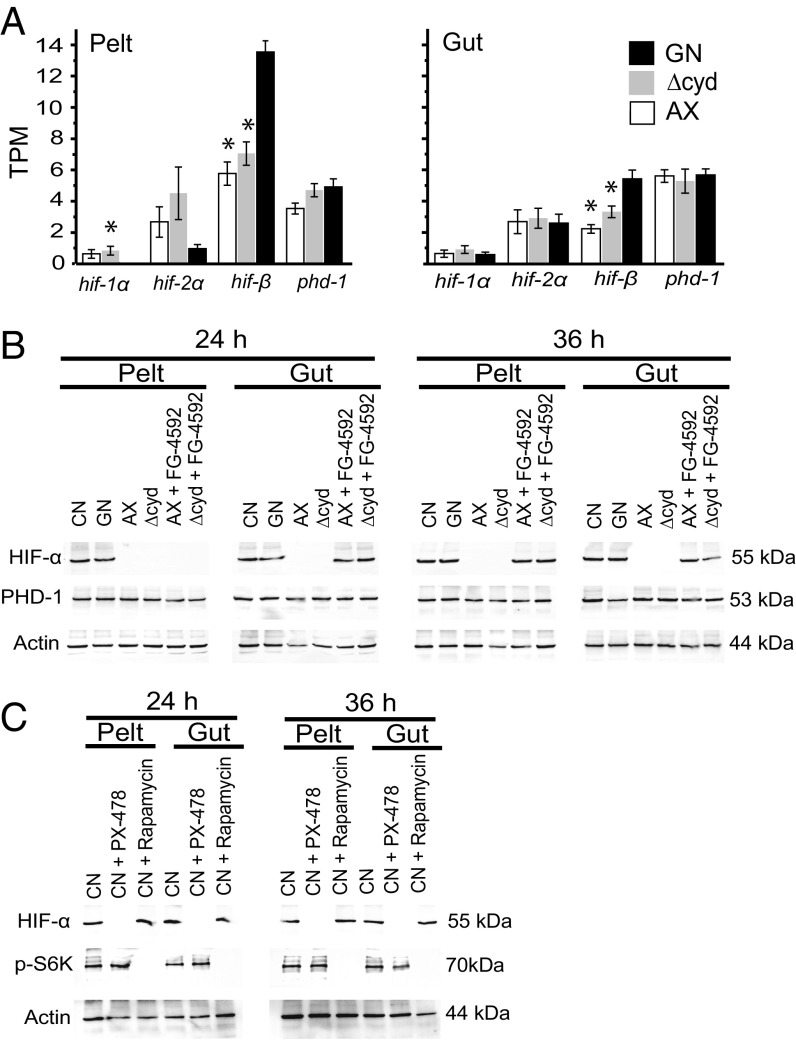
Fig. 1.
Detection of hypoxia pathway components in A. aegypti larvae. (A) Transcript abundance of hypoxia pathway genes in the gut and body (pelt) of first instars at 12 h posthatching. Treatments are gnotobiotic larvae inoculated with wild-type E. coli (GN), gnotobiotic larvae inoculated with ΔcydB-ΔcydD::kan E. coli (Δcyd), and axenic larvae (AX). Values are expressed in transcripts per kilobase million (TPM). For each gene, an asterisk above the bar indicates the treatment differed from GN, which served as the positive control (ANOVA followed by a post hoc Dunnett’s test, P < 0.05). (B) Immunoblots of pelt and gut extracts from conventional (CN) larvae, GN, AX, Δcyd, AX treated with FG-4592 (12 h posthatching), or Δcyd treated with FG-4592 (12 h posthatching). Samples were collected at 24 or 36 h and probed with antibodies to HIF-α, PHD-1, or actin (loading control). The molecular masses of HIF-α, PHD-1, and actin are indicated to the right of each blot. (C) Immunoblots of pelt and gut extracts from CN larvae and from CN larvae treated with PX-478 (12 h posthatching) or rapamycin (12 h posthatching). Samples were collected at 24 h and 36 h, and were probed with antibodies to HIF-α, p-S6K, or actin, with molecular masses of each indicated to the right of each blot.

