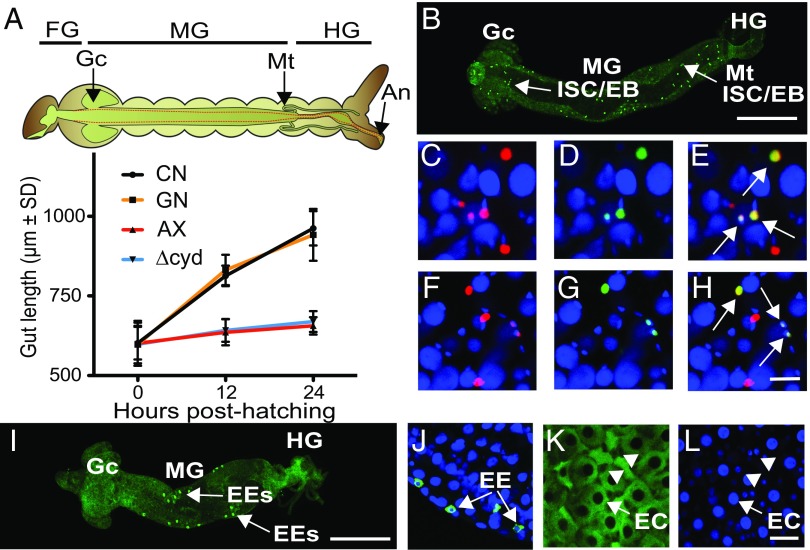
Fig. 3.
Bacteria that induce hypoxia promote gut growth. (A) Gut length in conventional (CN) larvae, gnotobiotic larvae inoculated with wild-type E. coli (GN), axenic larvae (AX), and gnotobiotic larvae inoculated with ΔcydB-ΔcydD::kan E. coli (Δcyd) at hatching (0 h), 12 h posthatching, and 24 h posthatching. Above the graph is shown a schematic of the A. aegypti larval digestive tract with borders of the foregut (FG), midgut (Mg), and hindgut (HG) indicated. The midgut is demarcated by the gastric caeca (Gc) and Malpighian tubules (Mt). Gut length in the graph was measured from the Gc to the end of the HG at the anus (An). Gut length at 12 h and 24 h significantly differed between CN larvae and GN that exhibit gut hypoxia versus AX and Δcyd that do not (ANOVA followed by a post hoc Tukey–Kramer honest significant difference test, P < 0.05). (B) Low-magnification image of a gut from a CN larva at 24 h posthatching. The FG was removed, resulting in the MG and HG being oriented from left to right. PH3+ ISCs/EBs (bright green) are distributed over the length of the MG. (Scale bar: 200 μm.) (C–E) High-magnification images from the midgut of a 24-h posthatching CN larva. Small cells with nuclei that are Slg+ (C, red), PH3+ (D, green), and Slg+/PH3+ (E, yellow with arrows) are shown. (F–H) High-magnification images from the midgut of a 24-h posthatching GN showing Slg+, PH3+, and Slg+/PH3+ cells as labeled in C–E. All nuclei in C–H are counterstained with Hoechst 33342 (blue). (Scale bar: H, 10 μm.) (I) Low-magnification image of a gut from a CN larva at 24 h posthatching showing EEs that are NPF+ (bright green). (Orientation and scale bar as in B.) (J) High-magnification image of gut cells from a 24-h CN larva labeled with anti-NPF (green) and Hoechst 33342. Note that EEs exhibit a cytoplasmic NPF+ signal (arrows), while nuclei are blue. High-magnification images of the midgut from a 24-h CN larva showing large, columnar ECs (arrows) with cytoplasm labeled by 2-DG6P (K) and nuclei labeled with Hoechst 33342 (L) are shown. Note that ISCs/EBs or EEs with small nuclei (arrowheads) are present between ECs in K and L. (Scale bar: L, 20 μm.)

