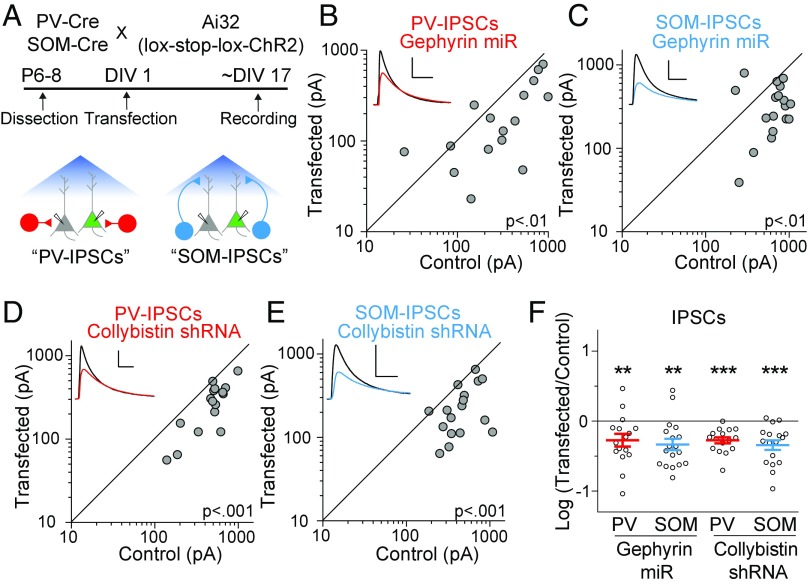
Fig. 1.
Reduction of gephyrin and collybistin affect both PV- and SOM-IPSCs. (A) Model showing mouse breeding scheme, experimental timelines, and patch-clamp configuration. (B) Scatter plots show amplitudes of IPSCs recorded from pairs of gephyrin miR transfected and control cells at ∼17DIV in PV:ChR2 mice. (C) Same as in B but with SOM:ChR2 mice. (D) Same as in B but transfecting with collybistin shRNA. (E) Same as in D but with SOM:ChR2 mice. (F) Summary plot showing IPSCs as a log10 of the ratio in transfected and control neurons, mean ± SEM (gephyrin miR: PV-IPSCs P < 0.01, n = 16; SOM-IPSCs, P < 0.01, n = 18; collybistin shRNA: PV-IPSCs P < 0.001, n = 16; SOM-IPSCs, P < 0.001, n = 17). Black sample traces are control and colored traces are transfected cells. (Scale bars: 200 pA and 40 ms.) **P < 0.01, ***P < 0.001.

