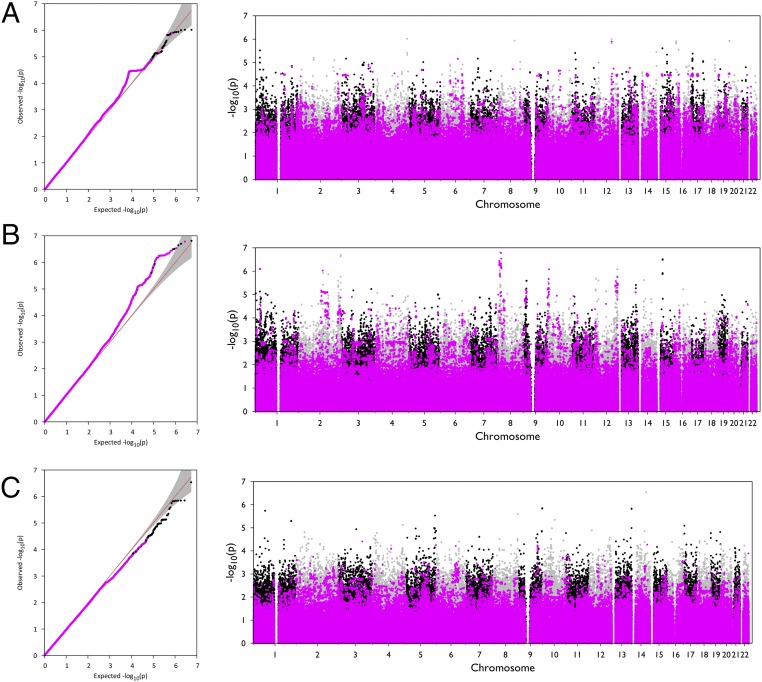
Fig. 4.
Single-variant association results for type 2 diabetes and glycemic traits. QQ and Manhattan plots for (A) T2D, (B) fasting glucose (adjusted for BMI), and (C) fasting insulin (adjusted for BMI). Only variants with MAF ≤1% in the 1000 Genomes phase I dataset are plotted. Variants that are only seen in one pedigree (that would be private in an unrelated sample) are highlighted in purple. The “step” in the T2D QQ plot is due to a group of variants shared by a nuclear family in one pedigree in which five members have T2D. No variant achieved a P value exceeding the experimentwide significance threshold of 7.1 × 10⁻⁸ for any of these three traits.

