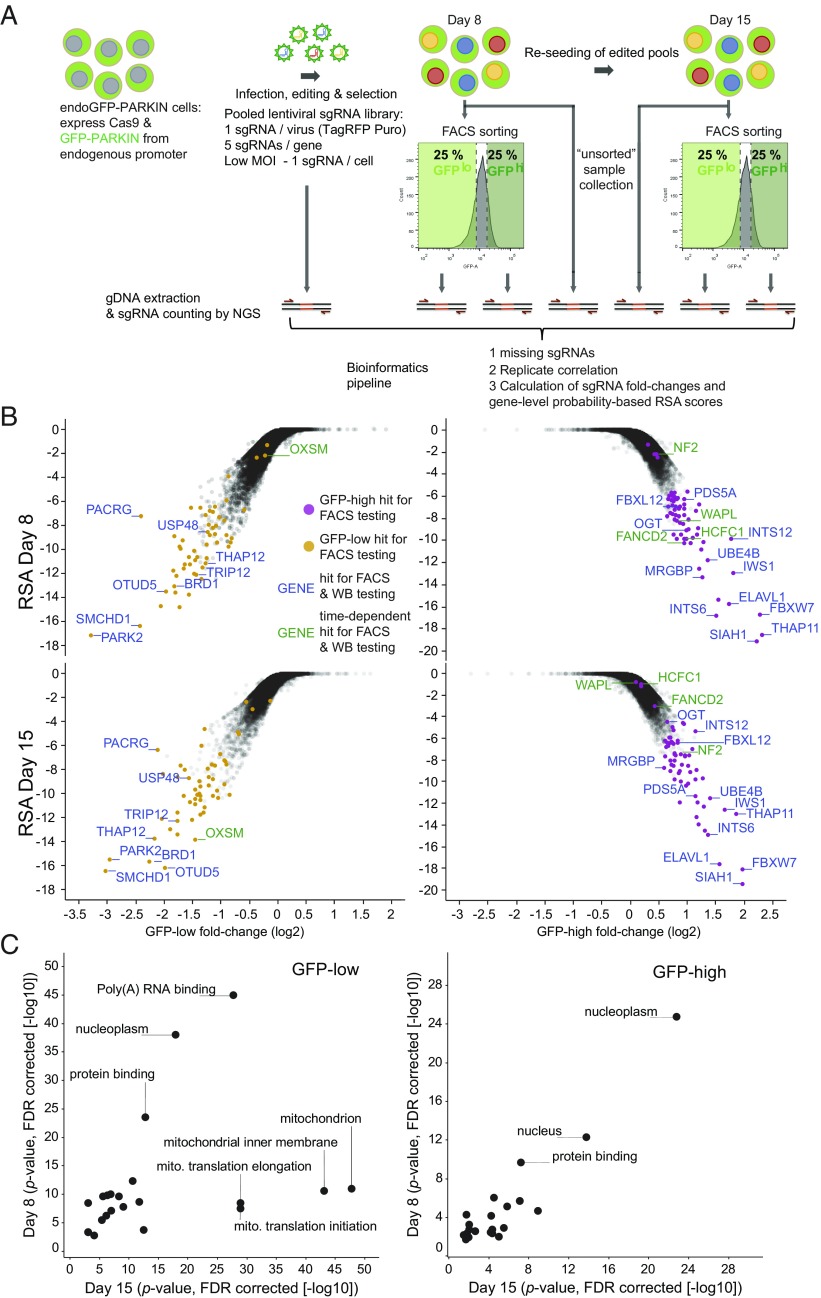
Fig. 2.
A genome-wide CRISPR/Cas9 screen identifies genes affecting cellular GFP-PARKIN level. (A) Workflow of the screening process. endoGFP-PARKIN cells were transduced with a lentiviral sgRNA library targeting 18,360 genes with an average of five sgRNAs per gene in independent replicates (n = 2). Infection was performed at a low MOI to achieve one sgRNA/cell. After selection, the least (GFP-low) and most (GFP-high) GFP-fluorescent cells (25%) were FACS-sorted on day 8 and day 15 postinfection, and genomic DNA was recovered from the unsorted and sorted pools and subjected to NGS for sgRNA counting. sgRNA count data were processed to assess missing sgRNAs as a measure of library coverage as well as replicate correlation. Count ratios for individual sgRNAs from GFP-low and -high are expressed as fold-change values and plotted against gene-level probability-based RSA scores. (B) Analysis of GFP-low and -high samples reveals candidate hit genes. (Upper) Day 8 analysis. (Lower) Day 15 analysis. y axis: RSA scores; x-axis: sgRNA fold-changes in GFP-low vs. GFP-high (second strongest sgRNA). Candidate hit genes selected for individual confirmation are colored, and genes selected for WB analysis are labeled (Fig. 3B) (green labeling for time-point–specific genes). (C) Hypergeometric gene-set enrichment analysis was performed using the top 500-scoring genes of either the GFP-low or -high analysis. The P values denoting the significance of the enrichments from day 8 are plotted against day 15 (−log10). FDR, false discovery rate; gDNA, genomic DNA; MOI, multiplicity of infection; NGS, next-generation sequencing; WB, Western blot.

