Fig. 3.
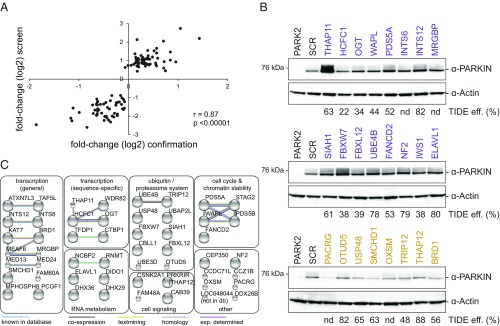
Confirmation of primary screen hit genes. (A) High correlation of individual sgRNA performance in the primary pooled screen and individual confirmation experiments. Day 8 fold-changes (log2) for the strongest scoring sgRNAs in the primary screen were plotted against fold-changes (log2) as determined in Fig. S3. Pearson’s correlation and corresponding significance values are shown. n = 108. (B) Lysates from endoGFP-PARKIN cells individually expressing the strongest scoring sgRNAs for 24 hits for 15 d were assessed for GFP-PARKIN levels and for CRISPR/Cas9 editing efficiencies by TIDE. (C) Fifty-three positive and negative regulators subjected to functional gene network analysis. Top and bottom 25 hits confirmed by flow cytometry on day 8 (Fig. S3), together with additional hits validated in B were used as input query for STRING database analysis of known and predicted protein-protein interactions (physical and functional). STRING gene annotations were used to group hits. The highest confidence cutoff was used (STRING V10.0). Large spheres, protein structure known; small spheres, no known protein structure. db, database; eff., efficiency; exp., experimentally; nd, not determined.

