Fig. 2.
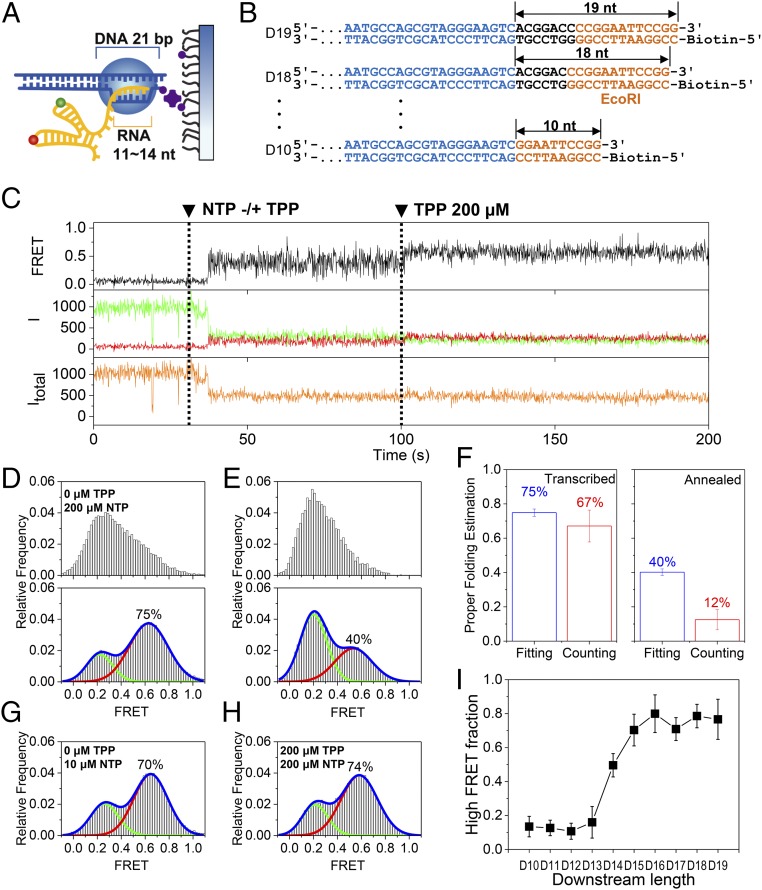
Cotranscriptional folding of the aptamer. (A) Model EC stalled on a surface. An RNA transcript of 11–14 nt and a DNA template of 21 bp are protected by the EC. (B) Series of DNA templates with varying downstream lengths (black) after the region of the aptamer (blue). DNA length was altered by progressive deletion of the downstream part, while maintaining the orange region. DNA templates are named D# according to their downstream length (#). (C) Representative time traces of the single-molecule cotranscriptional experiment with D17. Fluorescence intensities of a donor and an acceptor are colored in green and red, respectively, while the corresponding FRET appears in black. The total intensity (Itotal) is shown in orange. NTP (200 μM) and TPP (200 μM) were injected at 30 s and 100 s, respectively (dashed lines). (D) FRET histograms before (Top) and after (Bottom) 200 μM TPP injection for D17. (E) FRET histograms before (Top) and after (Bottom) 200 μM TPP injection for the thermally annealed synthetic aptamer. (F) Estimation of properly folded RNA for cotranscriptionally folded D17 (Left) and thermally annealed aptamer (Right). Two different methods were used: fitting the FRET histograms in D, Bottom and E, Bottom to two Gaussian functions (blue bars) and counting TPP-responsive molecules (red bars). Error bars represent SD from three experiments, each with more than 50 molecules. (G) FRET histogram for D17 at 10 μM NTP concentrations during transcription. (H) FRET histogram for D17 in the presence of 200 μM TPP during transcription. In D, G, and H, the TPP and NTP concentrations indicate the values used during the elongation phase, but the histograms were made after the injection of 200 μM TPP. (I) Fraction of the high FRET population of D10–D19. Error bars represent SD from three experiments, each with more than 50 molecules.

