Fig. 3.
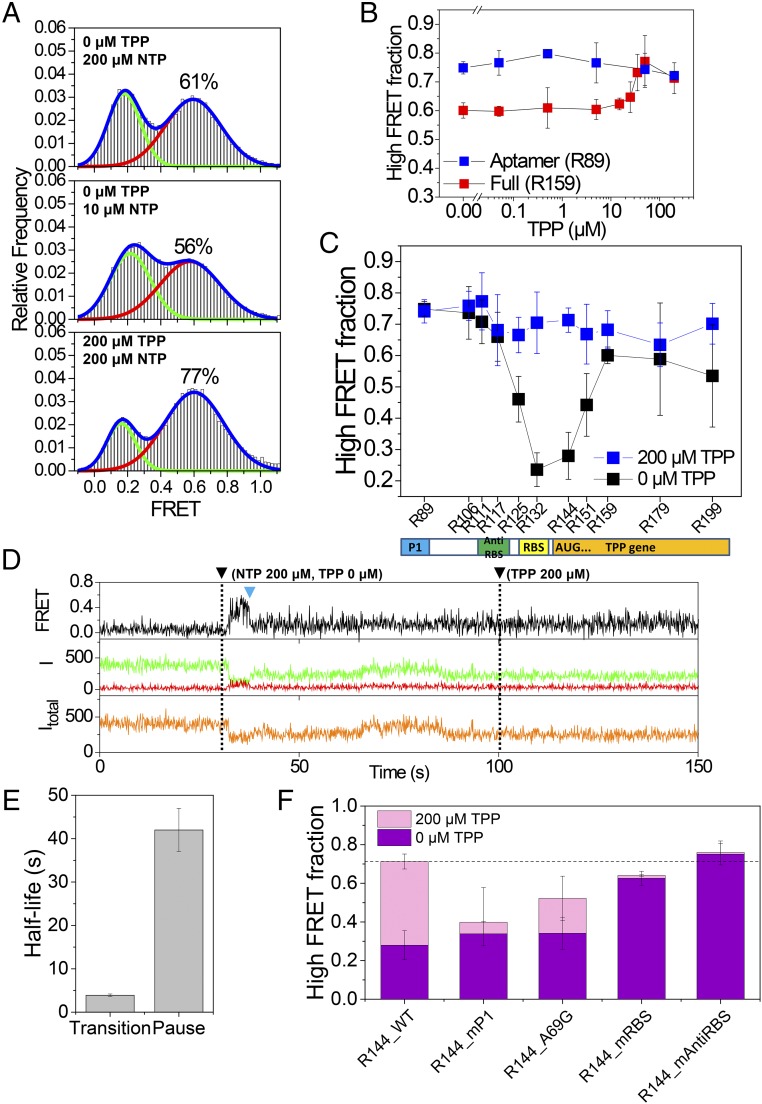
Cotranscriptional folding of the full TPP riboswitch. (A) FRET histograms of R159 under three different elongation conditions. FRET histograms were obtained in the presence of 200 μM TPP. (B) Fraction of the high FRET population of the aptamer (R89) and the full riboswitch (R159) with varying TPP concentrations during elongation. Error bars represent SD from three experiments, each with more than 50 molecules. (C) Fraction of the high FRET population of the riboswitch with varying lengths. Error bars represent SD from three experiments, each with more than 50 molecules. (D) Representative time trace that shows a transition (blue triangle) from the off conformation to the on conformation for R144 RNA. Fluorescence intensities of a donor and an acceptor are colored in green and red, respectively, while the corresponding FRET appears in black. The total intensity (Itotal) is shown in orange. NTP (200 μM) and TPP (200 μM) were injected at 30 s and 100 s, respectively (dashed lines). (E) Half-life of the off state of R144 and that of the transcriptional pausing of E. coli RNAP at the translation start codon region. (F) Fraction of the high FRET population of the riboswitch mutants. Error bars represent SD from three experiments, each with more than 50 molecules.

