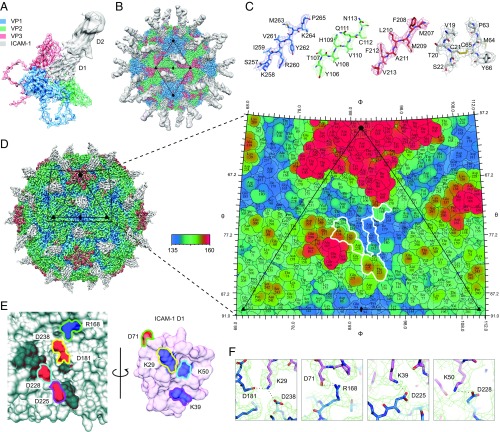
Fig. 2.
The structure of CV-A24v in complex with ICAM-1. (A) Enlarged tilted view of density denoted by a black triangle in B, containing the corresponding atomic model. ICAM-1 D1 binds in the “canyon” located at the quasi-threefold axis. (B) The cryo-EM reconstruction of CV-A24v in complex with ICAM-1 (D1D2) viewed down the icosahedral twofold axis. VP1-3 (3.6σ), D1 (1σ), and D2 (0.6σ). (C) Typical example of the cryo-EM electron density of VP1-3 and D1 domain. (D) Radially colored isosurface representation of CV-A24v in complex with D1 (gray) viewed down the icosahedral twofold axis (Left). The stereographic projection of the viral surface (Right), where the polar angles θ and φ represent latitude and longitude, respectively. Amino acids which interact with ICAM-1 D1 are located at the floor and wall of the canyon (blue) and are circled in white. The radial coloring key is shown in angstroms. (E) Surface representation of the EM-derived atomic model for the quasi-threefold axis of CV-A24v (gray) and ICAM-1 D1 (pink), with residues forming salt bridges labeled and colored in respect to their interacting partners. (Left) The surface of CV-A24v. (Right) The surface of ICAM-1 D1 that interacts with CV-A24v. Residues forming salt bridges are colored according to charge (red is negative, blue is positive) and capsid residues that hydrogen-bond with ICAM-1 are dark gray. (F) Overview of electrostatic interactions shown in E between ICAM-1 (pink) and CV-A24v (blue) with potential hydrogen bonds denoted as dotted black lines and EM density as a green mesh.

