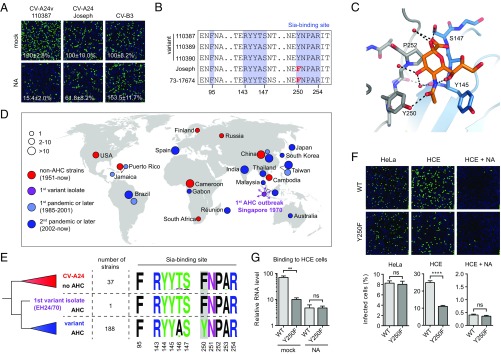
Fig. 4.
Pandemic CV-A24v strains have acquired a capsid residue that enhances Sia binding. (A) NA-treated HCE cells were infected on ice, followed by staining of infected cells with a dsRNA antibody (green) and nuclei with DAPI (blue). Percentage values denote mean ± SEM of three technical replicates, normalized to mock. (B) Amino acid sequence alignment of tested CV-A24 strains, with the residue unique for nonvariant strains highlighted in red. (C) Binding site for Sia (orange) in CV-A24v 110390 (PDB ID code 4Q4X), showing that the 5-N-acyl group of Sia is stabilized by two hydrogen bonds (dashed lines). Two adjacent VP1 proteins are colored gray and blue, respectively. Red spheres represent water molecules. Oxygen and nitrogen atoms are colored red and blue, respectively. (D) Geographic origins of non-AHC- (red) and AHC-causing (purple, light blue, blue) CV-A24 strains of which complete VP1 sequences are available, with circle sizes proportional to the number of isolates. (E) Phylogenetic tree of CV-A24 isolates, showing on the right side the frequencies of amino acids in the Sia-binding site among the indicated number of strains. Frequency plots were generated with WebLogo. Residues at VP1 position 250 are highlighted in gray. (F) HCE cells were treated with NA and infected on ice with CV-A24v 110390 or the VP1 Y250F mutant, followed by staining of dsRNA (green) and nuclei (blue). Quantifications shown at the bottom denote mean ± SEM of four technical and two biological replicates. Images shown in A and F are representative confocal micrographs. (G) HCE cells were treated with a mixture of A. urefaciens and V. cholerae NA (1:30) and incubated with virus on ice, followed by qPCR analysis of bound virus. Error bars represent the mean ± SEM of three biological replicates. P values (F and G) were calculated by an unpaired two-sided t test; not significant (ns), P ≥ 0.05; **P < 0.01; ****P < 0.0001.

