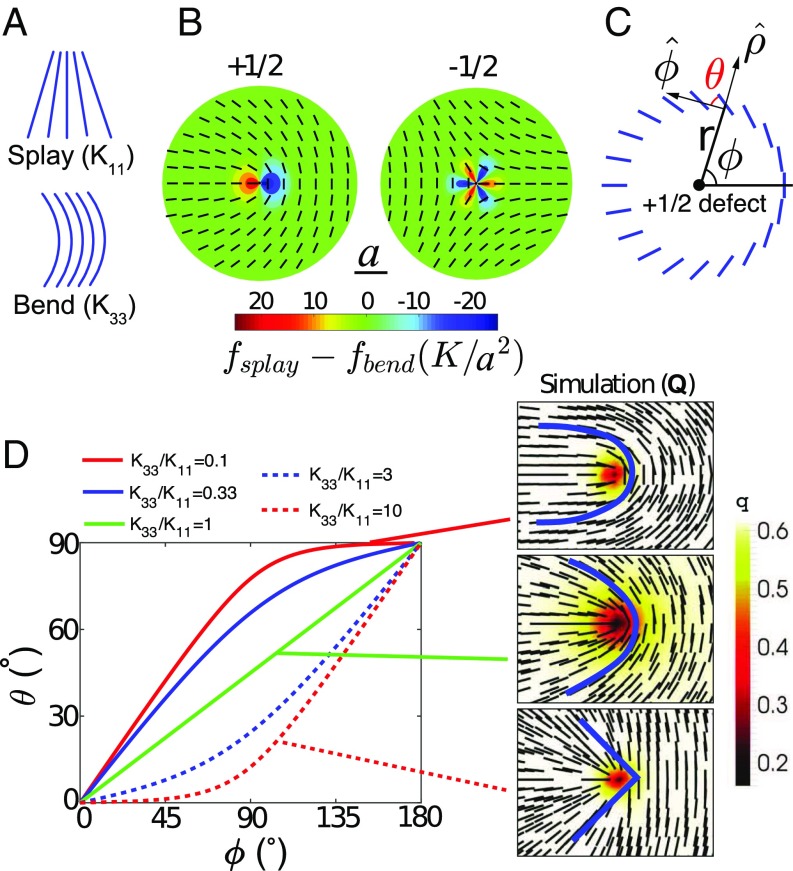
Fig. 1.
Morphology of defects. (A) Illustration of splay and bend distortion in nematic LC. (B) The director fields of and defect under one-elastic-constant approximation. The color indicates the difference in splay and bend energy density; is the unit length scale. (C) Quantitative description of defect morphology: is the polar coordinate; is the angle between the director and the angular vector . (D) The morphology of defects as a function of elastic constant ratio . Right images are the Q-tensor–based simulation results. Blue curves following the local director field are added to guide the eye.

