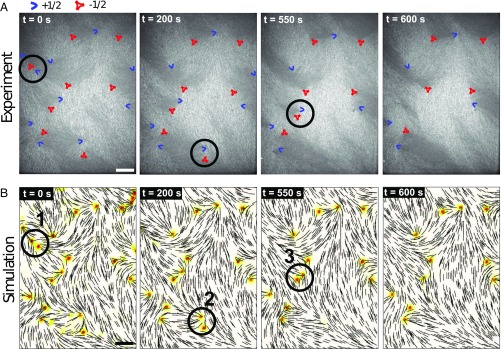
Fig. 6.
Actin-based LC “weather map.” (A) Consecutive optical images from actin LC equilibration process; blue boomerangs represent defects, and red triangles indicate defects. (B) Consecutive simulation images corresponding to the experiments; black lines depict the local director field, and the background color indicates scalar order parameter (adopting the same colorbar as in Fig. 1). The circled defects annihilate in the next frame. (Scale bars, m.)

