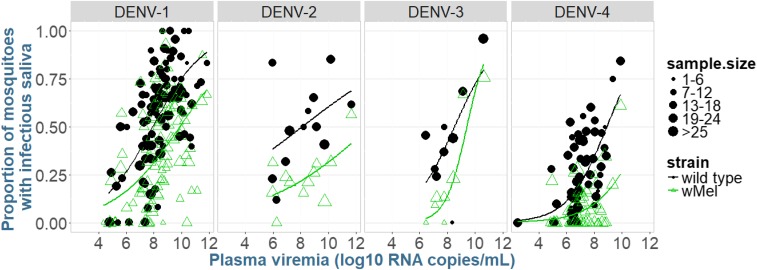
Fig. 1.
Proportion of mosquitoes with infectious virus in their saliva, as a function of log10 plasma viremia (RNA copies per milliliter). Within each panel, the scatterplots and corresponding smooth curves based on logistic regression are shown, with panels separating virus serotypes. Data points represent the proportion of mosquitoes in a given unique cohort of WT or wMel mosquitoes that had infectious saliva on the day of harvesting. Data are pooled from day 10, 12, 14, and 16 harvesting time points. The size of the dot indicates the number of mosquitoes in that cohort.

