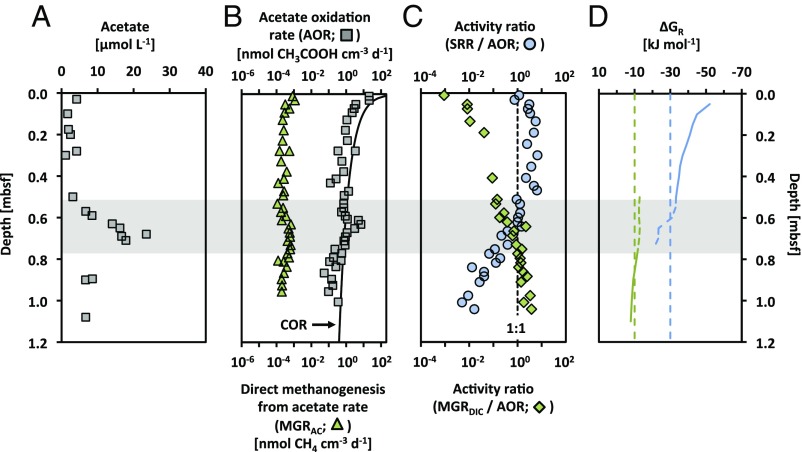
Fig. 2.
Acetate turnover in station BB03 sediment. (A) Down-core profile of acetate concentrations in the pore water. (B) AOR accounted for about one-third and half of the COR above and below the SMT (shaded zone), respectively, and they were about 1,000-fold higher than the rates of direct methanogenesis from acetate. (C) Activity ratios indicate the electron/mass balance between SRR and AOR or MGRDIC and AOR, with the dashed line indicating a 1:1 ratio. (D) Gibbs energy yield (ΔGR) for acetate metabolism via sulfate reduction (blue line) or via methane production (green line) is shown relative to suggested minimum energy levels of sulfate-reducing prokaryotes (dashed blue line) (29) and methanogenic archaea (dashed green line) (26). Data for other stations are shown in Figs. S7–S9.

