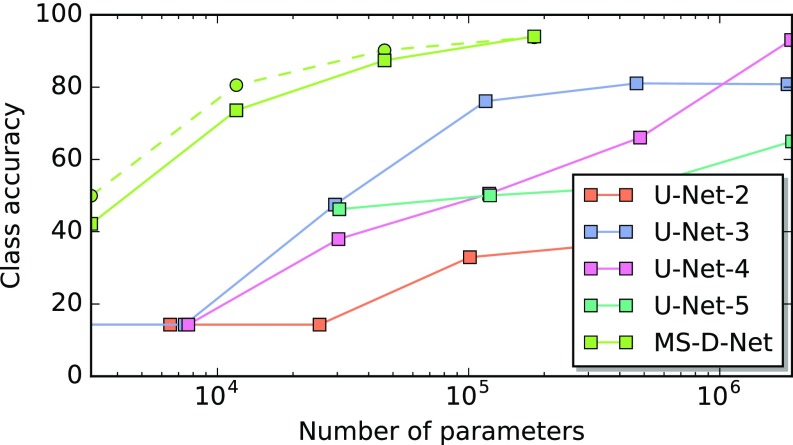
Fig. 5.
The class accuracy of a set of 100 simulated images (Fig. 4) as a function of the number of trainable parameters for the proposed MS-D network architecture and the popular U-Net architecture. For each U-Net network (U-Net-), indicates the number of scaling operations used. For the MS-D architecture, results are shown for dilations (solid line) and (dashed line).

