Fig. 1.
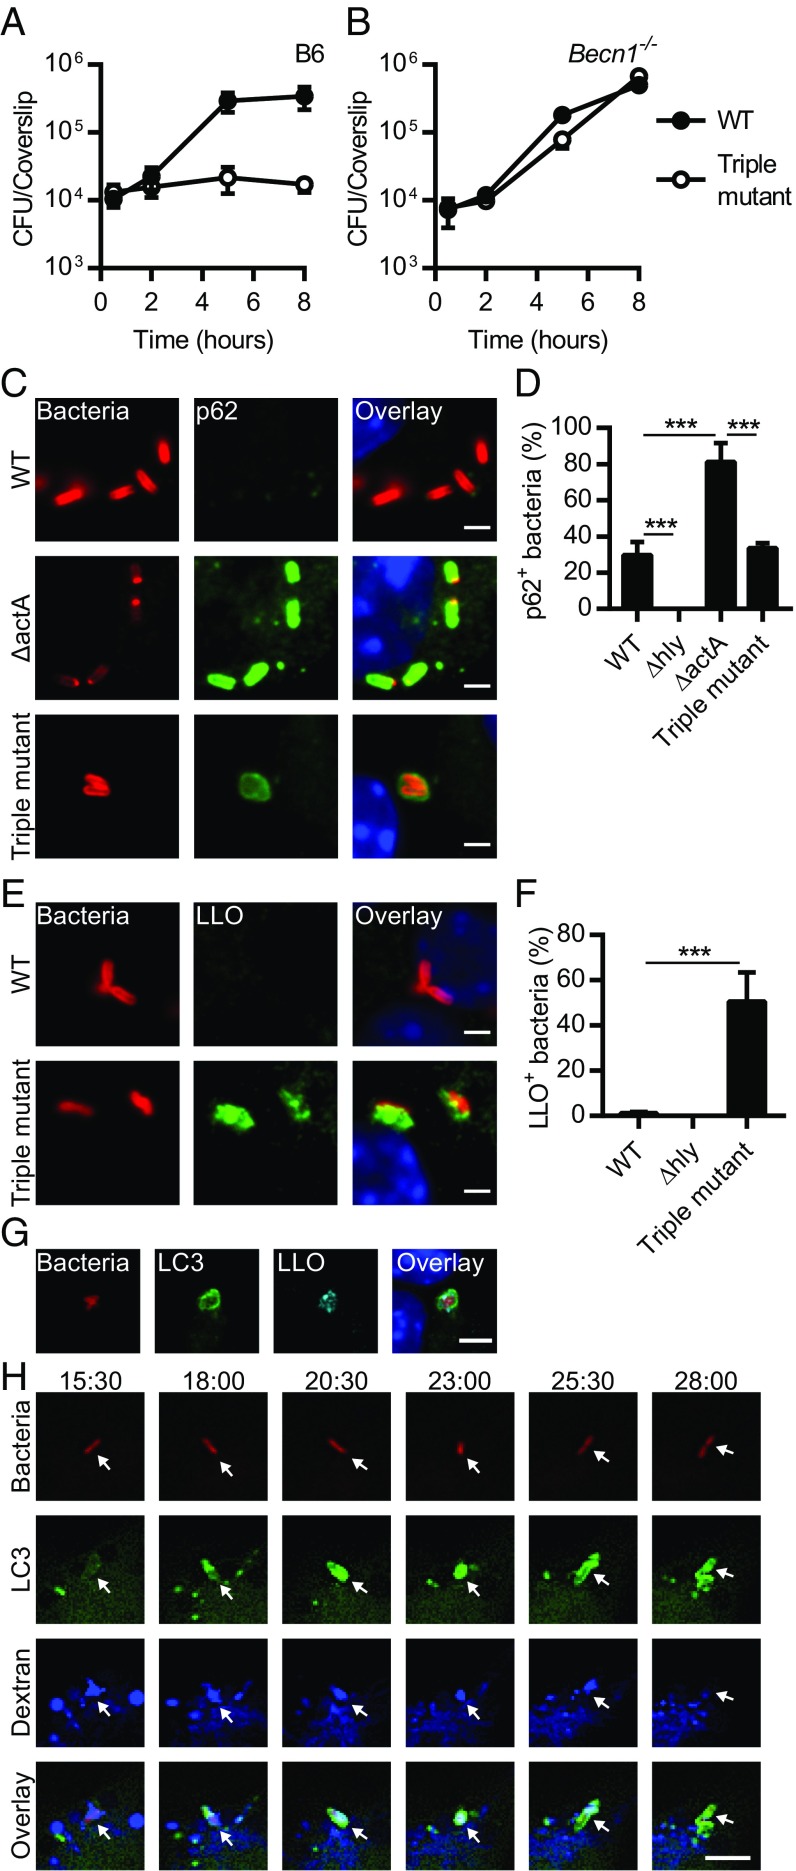
L. monocytogenes escapes from an autophagic process that targets damaged vacuoles. Growth kinetics of WT L. monocytogenes and the triple mutant lacking ActA, PlcA, and PlcB in B6 (A) and Becn1−/− (B) BMMs (n = 2–4). (C) Representative micrographs of BMMs infected for 2 h with WT, ΔactA, and the triple mutant. Infected cells were stained for L. monocytogenes (red), p62 (green), and DNA (blue). (D) Colocalization of p62 with WT, Δhly, ΔactA, and the triple mutant in BMMs infected for 2 h. Relevant statistically significant differences are indicated [***P < 0.001 (ANOVA with Tukey’s post hoc test); n = 5]. (E) Representative micrographs of BMMs infected with WT and the triple mutant for 2 h and stained with L. monocytogenes (red), LLO (green), and DNA (blue). (F) Colocalization of LLO with WT, Δhly, and the triple mutant in BMMs infected for 2 h. Relevant statistically significant differences are indicated [***P < 0.001 (ANOVA with Tukey’s post hoc test); n = 3]. (G) Representative micrographs of GFP-LC3 BMMs infected with the triple mutant for 2 h and stained for L. monocytogenes (red), GFP-LC3 (green), LLO (cyan), and DNA (blue). (H) Selected Z-stacked micrographs from a time-lapse microscopy experiment performed with GFP-LC3 (green) BMMs infected with the triple mutant expressing mCherry (red) in presence of fluorescent dextran (blue). Arrowheads indicate the position of bacteria in the different channels and at different time points. Times are indicated (min:s) above the top row. Results are expressed as means and SDs. (Scale bars: C and E, 2 µm; G and H, 5 µm.)

