Fig. 1.
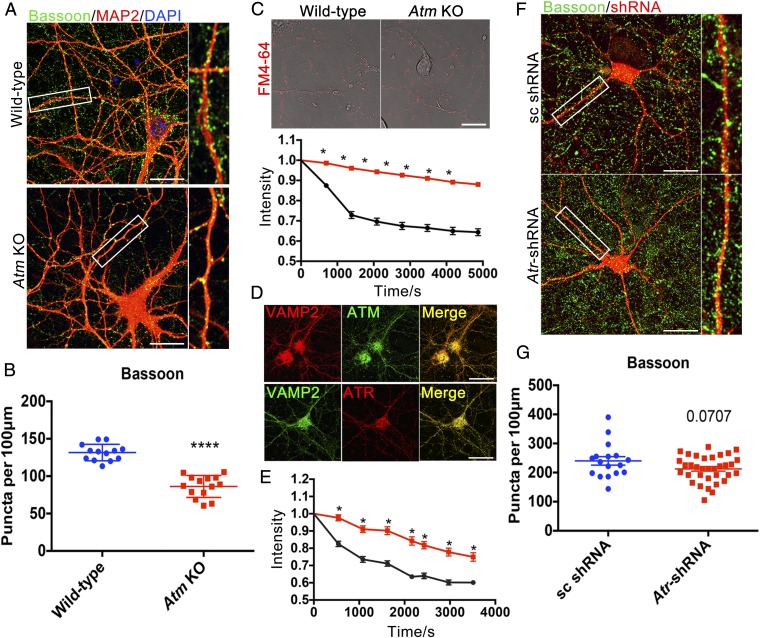
ATM or ATR loss causes synaptic deficiency. (A) Cultured cortical neurons from WT or Atm KO mice were immunolabeled with anti-Bassoon (green) and anti-MAP2 (red) antibodies. (Scale bar: 20 μm.) (B) Quantification of Bassoon puncta in WT and Atm KO cortical neurons. n = 13–14 neurons from three batches of neuronal cultures. Error bars represent SEM. ****P < 0.0001, unpaired t test. (C) Representative images and quantification results of FM4-64 dye spontaneous release from neurites of WT (black) and Atm KO (red) cultures. (Scale bar: 20 μm.) n = 102–200 individual measurements from four independent neuron cultures. Error bars represent SEM. Significance of the difference between the curves, *P < 0.05 (multiple t tests). (D) Confocal images of WT cortical neurons stained with anti-VAMP2 (red), anti-ATM [2C1(1A1)] (green), or anti-ATR (red) antibodies. (Scale bar: 20 μm.) (E) Atr knockdown (red) with shRNA. n = 40–60 individual measurements from four separate neuronal cultures. Error bars represent SEM. Significance of the difference between the curves, *P < 0.05 (multiple t tests). (F) Scrambled (sc) or Atr-shRNA (red) transfected cortical neurons immunolabeled with anti-Bassoon (green) antibody. (Scale bar: 20 μm.) (G) Quantification of Bassoon (presynaptic puncta) density in control and Atr knockdown neurons. n = 17∼34 neurons from three different neuronal cultures. Error bars represent SEM. P = 0.0707, unpaired t test.

