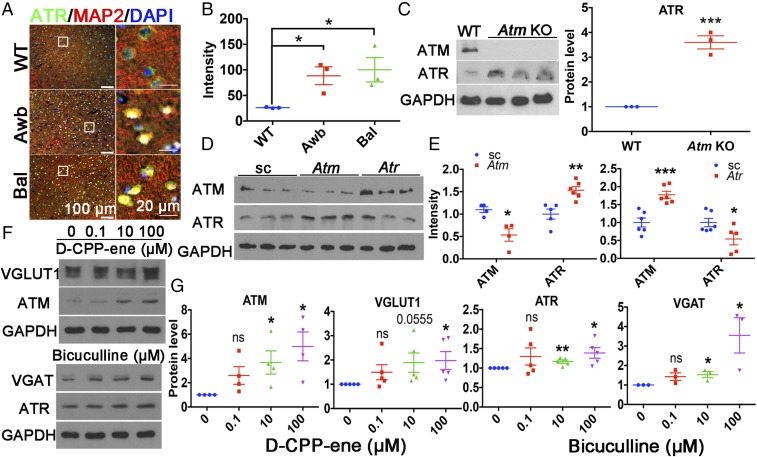
Fig. 2.
ATM and ATR protein levels show a reciprocal relationship. (A) Brain sections from 2-mo-old WT, Atmtm1Awb/Atmtm1Awb (Awb), and Atmtm1Bal/Atmtm1Bal (Bal) mice were labeled with ATR (green) or MAP2 (red) antibodies and counterstained with DAPI (blue). (Scale bars: as marked.) (B) ATR immunostaining intensity. n = 3 animals for each group. Error bars represent SEM. *P = 0.0232; *P = 0.036, unpaired t test. (C) Western blots of Atm KO (Awb) and WT cortical lysates. Actin served as a loading control. n = 3 animals for each group. Error bars represent SEM. ***P = 0.0006, unpaired t test. (D) Western blots of HEK293T cells lysates obtained at 48 h after transfection with Atm-shRNA or Atr-shRNA. GAPDH served as a loading control. (E) Quantification of the blots shown in D. n = 4–6 independent cultures. Error bars represent SEM. ***P = 0.0007; *P = 0.01; *P = 0.0445; **P = 0.0032, unpaired t test. (F) Western blots of ATM, ATR, VGLUT1, and VGAT of lysates from 21 DIV cortical neurons treated with D-CPP-ene or bicuculline for 24 h. (G) Quantification of the blots shown in F. n = 3∼4 independent neuronal cultures. Error bars represent SEM. For ATM, *P = 0.0317, *P = 0.0152; for VGLUT1, *P = 0.03; for ATR, **P = 0.0046, *P = 0.0213; for VGAT, *P = 0.0293, *P = 0.0479, unpaired t test.

