Fig. 3.
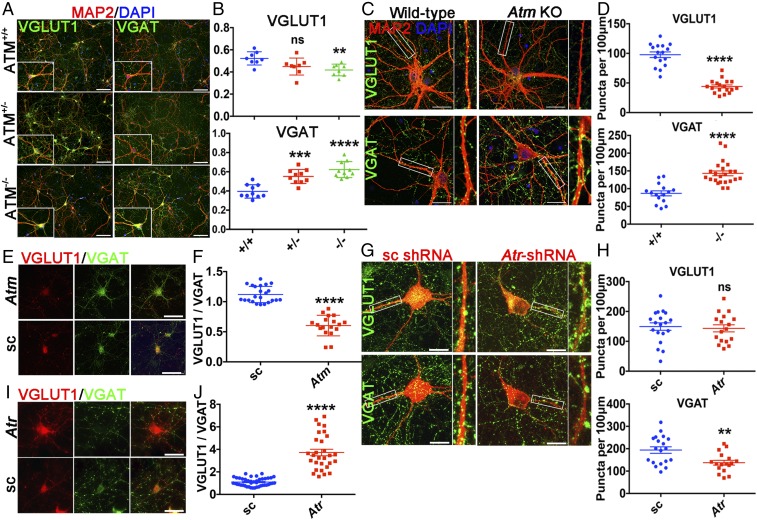
ATM or ATR deficiency leads to excitatory/inhibitory (E/I) imbalance. (A) 21 DIV cortical neurons isolated from Bal mice—heterozygous (Atm+/−), homozygous (Atm−/−), and WT (Atm+/+)— were stained with the indicated antibodies. (Scale bar: 100 μm.) (B) Percentages of VGLUT1+ and VGAT+ neurons in these cultures. n = 8–10 coverslips of neurons from four independent cultures. Error bars represent SEM. ns, P = 0.0512; **P = 0.0024; ***P = 0.0001; ****P < 0.0001, unpaired t test. (C) Representative confocal images of WT and Atm KO cortical neurons, stained with MAP2 (red), VGLUT1 (green), or VGAT (green) antibodies. (Scale bar: 20 μm.) High-magnification images show VGLUT1 or VGAT puncta on MAP2+ neurites. (D) Quantification of VGLUT1 and VGAT puncta in C. n = 15–23 neurons from four independent cultures. Error bars represent SEM. ****P < 0.0001, unpaired t test. (E) Atm or scrambled shRNA-transfected neurons immunolabeled by anti-VGLUT1 (red) and anti-VGAT (green) antibodies. (Scale bar: 50 μm.) (F) Ratio of VGLUT1 to VGAT protein intensity in E. n = 18–23 neurons from four independent cultures. Error bars represent SEM. ****P < 0.0001, unpaired t test. (G) Confocal images of scrambled or Atr shRNA (red)-transfected neurons, stained with anti-VGLUT1 (green) or anti-VGAT (green). (Scale bar: 20 μm.) High-magnification images show VGLUT1 or VGAT puncta on neurites. (H) Quantification of VGLUT1 and VGAT puncta in G. n = 17–19 neurons from three independent cultures. Error bars represent SEM. ns, P = 0.7341; **P = 0.0041, unpaired t test. (I) Atr or scrambled shRNA-transfected neurons immunolabeled with VGLUT1 (red) and VGAT (green) antibodies. (Scale bar: 50 μm.) (J) Ratio of VGLUT1 to VGAT protein intensity in I. n = 29–43 neurons from four independent cultures. Error bar represents SEM. ****P < 0.0001, unpaired t test.

