Fig. 3.
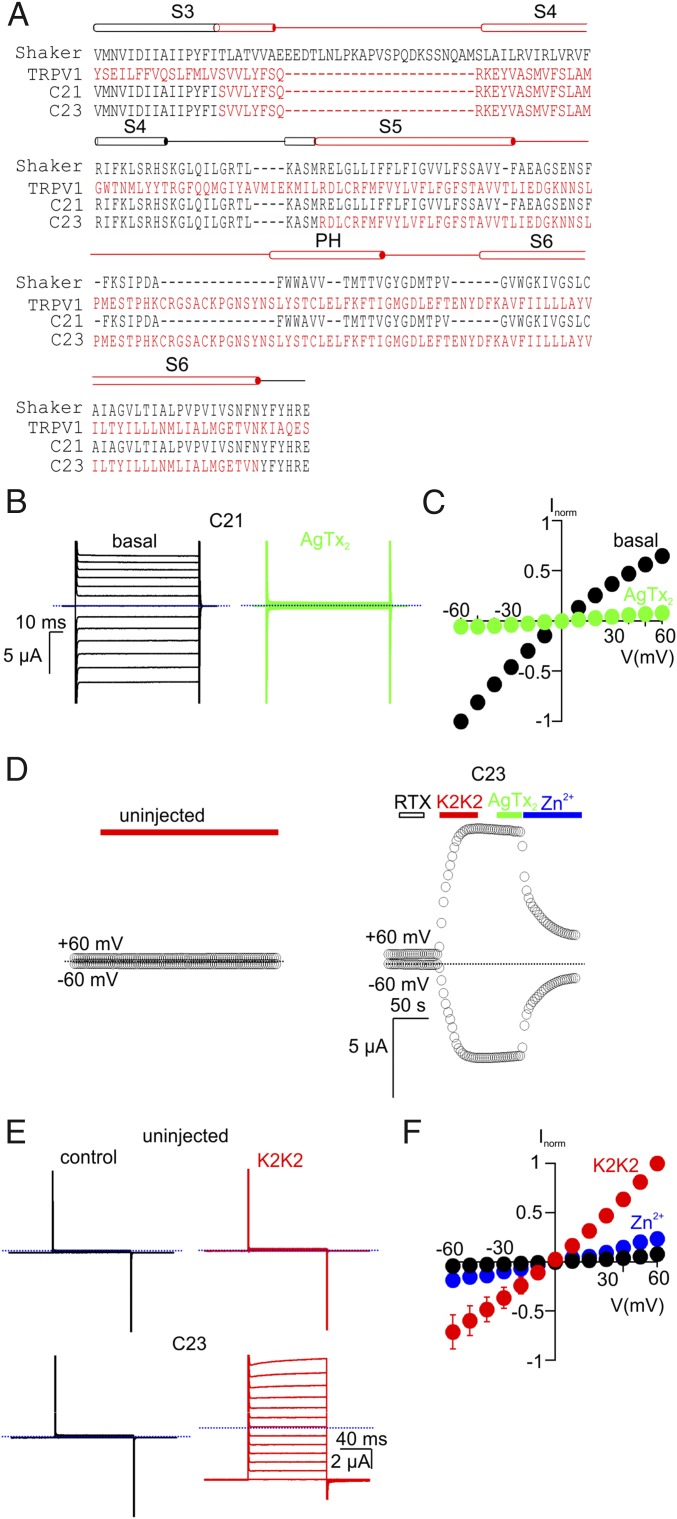
Transfer of the paddle motif from TRPV1 into the C11 chimera does not alter its functional properties. (A) Sequence alignment of Shaker (black), TRPV1 (red), and the C21 and C23 chimeras from S3 through S6. (B) Representative current traces from cells expressing C21 before (Left) and after (Right) the addition of 100 nM AgTx-2 (Vhold = 0 mV; test depolarizations from −60 to +60 mV in 10-mV increments). (C) Normalized I–V relations obtained in the absence (black symbols) or presence of AgTx-2 (100 nM, green symbols) obtained from experiments as in B. Currents were normalized to the amplitude of current at −60 mV in control solutions (mean ± SEM for n = 5). (D) Representative time courses for membrane currents recorded at −60 and +60 mV from an uninjected oocyte (Left; control) and an oocyte injected with the C23 chimera (Right). Cells were held at Vhold = −60 mV and voltage was stepped to +60 mV for 100 ms at 3-s intervals. Mean inward current at −60 mV and outward current at +60 mV are plotted as a function of time. RTx (100 nM), K2K2 (5 µM), AgTx-2 (100 nM), and Zn2+ (2 mM) were applied as indicated by the horizontal bars. The dotted blue lines denote the zero-current level. The external recording solution contained (in millimoles/liter): 100 KCl, 10 Hepes, 2 MgCl2, pH 7.4. (E) Representative current traces from an uninjected cell (Top) and a C23-expressing cell (Bottom) before (Left) and after (Right) the addition of 5 µM K2K2 (Vhold = −60 mV; test depolarizations from −60 to +60 mV in 10-mV increments). (F) Normalized I–V relations before (black symbols) and after K2K2 application (5 µM, red symbols), followed by Zn2+ application (2 mM, blue symbols), obtained from experiments as in E. Currents were normalized to the amplitude of current in the presence of 5 µM K2K2 at +60 mV (mean ± SEM for n = 4).

