Fig. 4.
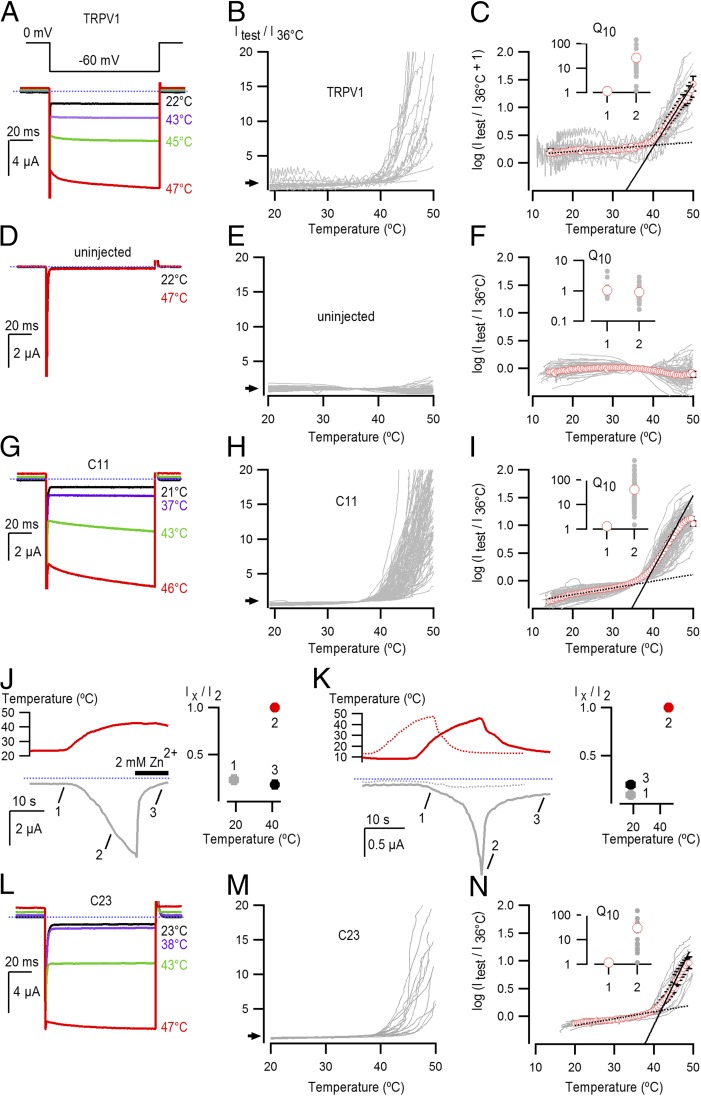
Heat activation of TRPV1 and the C11 chimera. (A) Representative current traces for TPRV1-expressing cells activated by heating. Pulses from 0 to −60 mV were given at 2 Hz. (B) Current vs. temperature relations at −60 mV obtained from experiments as in A for temperatures from 20 °C to 50 °C, with the mean current values at the end of each pulse to −60 mV displayed as a line graph. Individual cells are shown with currents normalized by their amplitude at 36 °C (n = 24). (C) Plot of log (Itest/I36 °C + 1) obtained from the relations in A with the mean relation shown as red circles ± the SEM. The ratio of Itest/I36 °C was offset by arbitrarily adding a value of 1 to the data to avoid large distortions in the log curves at lower temperatures, resulting from having small leak currents where some data points are ≤0. The linear fit at low temperatures (dotted black line) had a Q10 of 1.1, while that at high temperatures (continuous black line) had a Q10 of 26.8. The Inset shows Q10 values for low and high temperatures from fits to data from individual cells (gray circles) and red circles representing the mean values ± the SEM in black. (D–F) Representative current traces, temperature-activation relations, and Q10 determinations for cells not expressing exogenous channels (n = 88). (G–I) Representative current traces, temperature-activation relations, and Q10 determinations for cells expressing the C11 chimera (n = 108). The fit at low temperatures had a Q10 of 1.3, while that at high temperatures had a Q10 of 40.8. (J) Representative current time course for C11 obtained similarly as in G, showing Zn2+ block of temperature-activated currents. Temperature is shown in red on the Upper Inset, and it was increased from room temperature to ∼42 °C, after which a solution supplemented with 2 mM Zn2+ at an equally high temperature was applied (denoted by the thick black horizontal line). The dotted blue line denotes the zero-current level. Data from a population of cells was pooled after normalizing the initial current at room temperature (1) and the current after Zn2+ application at high temperature (3) to the current at an equivalent temperature before Zn2+ application (2). The resulting mean ± SEM for both temperature and current (n = 4) are shown on the Inset to the right, where the y axis denotes normalized current and the x axis the temperature in which the pooled data were obtained. (K) Representative current time courses showing C11 (continuous gray curve) activation by heating, followed by deactivation upon cooling, obtained similarly to G. Temperature for the C11 experiment is shown as a continuous red curve at the Top. The dotted gray and red curves represent the current and temperature time courses for an uninjected oocyte from the same batch of oocytes as the C11 recordings. The blue dotted line denotes the zero-current level. Population data for C11 was pooled by normalizing the current at low temperature following heat activation (3) and the current at an equivalent temperature before heating (1) to the peak current measured at the maximal temperature (2), and is presented in the Inset on the Right. Data are shown as mean ± SEM for both temperature (x axis) and current (y axis) (n = 3). (L–N) Representative current traces, temperature-activation relations, and Q10 determinations for cells expressing the C23 chimera (n = 16). The fit at low temperatures had a Q10 of 1.2, while that at high temperatures had a Q10 of 29.8.

