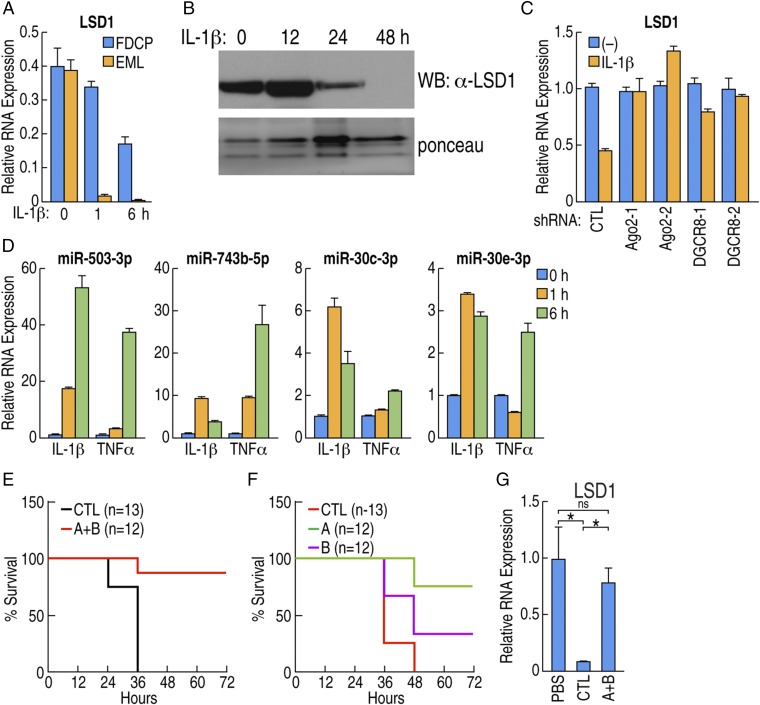
Fig. 4.
miRNA-mediated down-regulation of LSD1 in response to inflammatory cytokines. (A) FDCPmix cell (blue bar) or EML cell (orange bar) were treated with IL-1β. LSD1 mRNA levels are shown, measured by RT-qPCR. (B) FDCPmix cells were treated with IL-1β, and LSD1 expression was determined by Western blot; Ponceau S staining as loading control. (C) FDCPmix cells were transduced with lentiviral vectors carrying two independent shRNAs against argonout2 (Ago2) or DGCR8, and mRNA expression of LSD1 after IL-1β treatment was measured by RT-qPCR. (D) FDCPmix cells were stimulated by IL-1β or TNF-α for the indicated time, and the expression level of indicated miRNA was determined by qPCR. (E) Wild-type mice were reconstituted with BM cells transduced with pooled lentiviral vectors carrying antisense for indicated miRNAs (n = 12, group A+B, see text for grouping) or scramble control (n = 12). After reconstitution, mice were injected with 24 mg/kg LPS to induce sepsis, and the survival curve is shown. (F) Wild-type mice were reconstituted with BM cells transduced with pooled lentiviral vectors carrying antisense against miRNAs (scramble control, n = 12, group A, n = 12 or group B, n = 12). After reconstitution, mice were injected with 24 mg/kg LPS, and survival curve is shown. (G) Expression of LSD1 was determined in animals described in E. BM cells were isolated 36 h after LPS injection, and LSD1 expression is shown as an average of four animals. *P < 0.01; ns, not significant.

