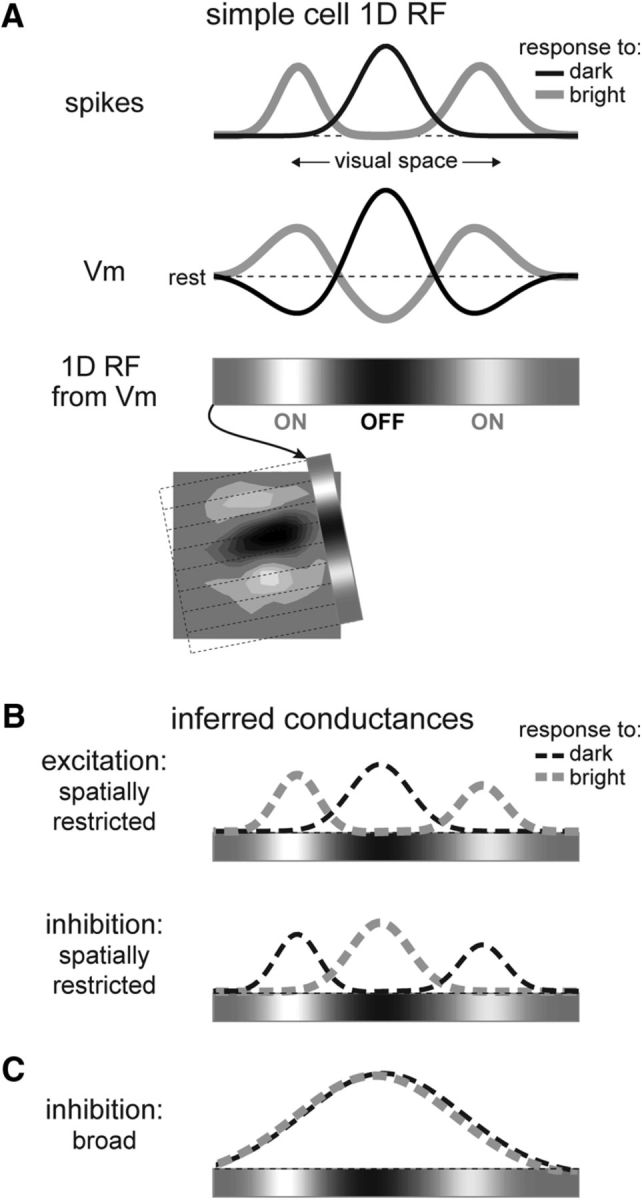
Figure 1.

Push–pull organization of simple cell receptive fields. A, Top, Schematized spike and Vm responses characterizing the 1D RF of a simple cell. Bottom, Grayscale colorbar representation of the 1D RF, calculated from Gaussian fits to Vm depolarizing responses to bright minus dark. Inset shows agreement between 1D and 2D RF estimates for an example cell (data shown in Fig. 2). B, Possible arrangements of synaptic conductances proposed to underlie the Vm responses. Classically, excitatory (top) and inhibitory (bottom) inputs are assumed to be arranged in a spatially restricted and antiphase organization, matching the patterns of Vm depolarization and hyperpolarization, respectively. C, We test the hypothesis that inhibition is broad across the RF.
