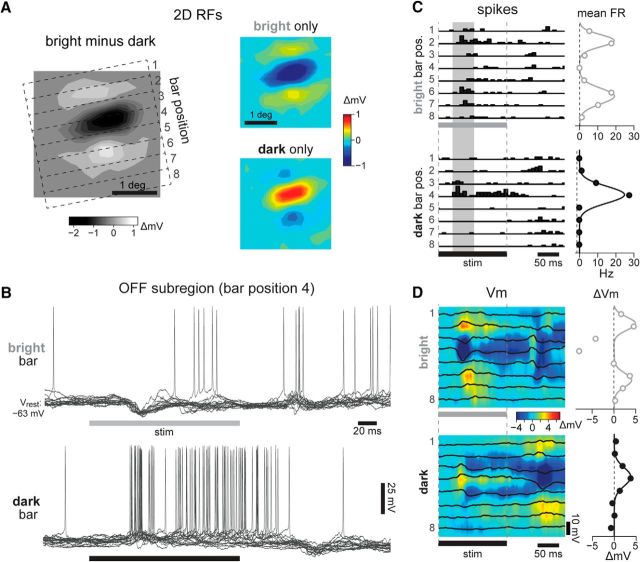
Figure 2.
Spatial structure of simple cell receptive fields. A, Left, 2D RF of a simple cell in our dataset, estimated from forward correlation of the Vm at t = 105 ms. The RF spanned 2.3° in width, and its optimal orientation was 101°. Dashed lines outline 8 bar positions, each 0.4° wide, used as stimuli for 1D RF characterization. The 2D RF was obtained by subtracting the average Vm responses to dark stimuli (right, bottom) from responses to bright (right, top); red indicates depolarization, and blue indicates hyperpolarization. B, Vm responses to bright (top) and dark (bottom) bars presented in the OFF subregion, at position 4 (16 trials). Horizontal bars, stimulus on time of 160 ms. C, Left, PSTH of spiking responses at each bar position, bright (top) and dark (bottom). Vertical shaded regions show 50 ms window used to calculate response firing rate (FR). Right, Mean FR (points) and Gaussian fits (curves), calculated separately for each RF subregion. D, Left, Average ΔVm traces (black lines) after off-line spike removal, for all bar positions and contrasts. Pseudocolor maps show interpolation of these traces across time and space. Vrest = −64 mV. Right, Vm responses at the time of peak response across positions, displayed as in C. Note that the strong hyperpolarization in response to bright bars in the OFF subregion was excluded from the Gaussian fits defining the flanking ON subregions.

