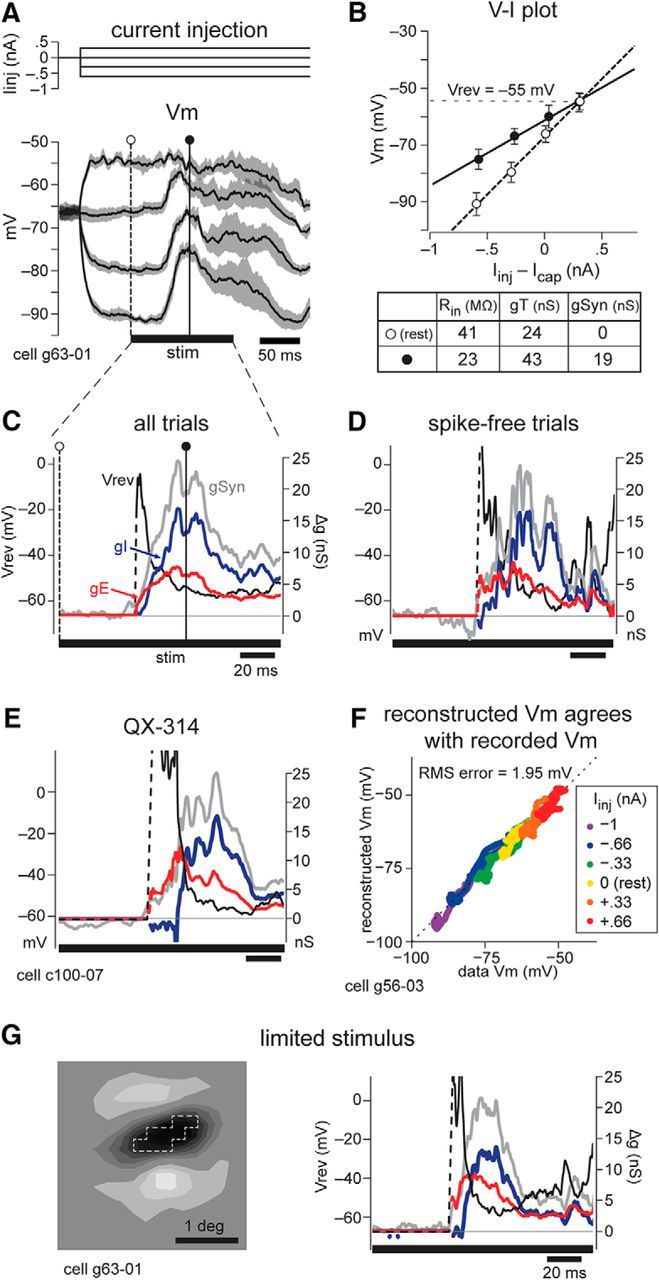
Figure 3.

Conductance estimation. A, Top, Levels of current injection through the pipette that were paired with presentations of visual stimuli and used for conductance estimation. Bottom, average ± 95% confidence interval of 12 trials at each of the four levels of current injection. Stimulus on a time of 128 ms shown as the bar under the traces. The time points indicated correspond with points used for the I–V plot in B and are shown in C. B, Linear I–V relationship at rest (open circles, dashed line is linear fit, error bars show 1 SD) and at the time point indicated in A (filled circles, solid line). The slope of each line gives the Rin, and the inverse yields total conductance gT. During the synaptic response, gSyn is calculated as gT(t) − gT(rest). The intersection of the two lines gives the synaptic reversal potential (Vrev) for that time in the response. C–E, G, Vrev (black), gSyn (gray), excitatory conductance (gE, red), and inhibitory conductance (gI, blue) as a function of time throughout the synaptic response to the visual stimulus. C, Vertical line indicates the filled circle time point shown in A and B. D, Analysis using only trials without action potentials. E, An excitatory bar stimulus in a cell recorded with QX-314 in the recording pipette (dark bar in position 7, OFF subregion, of the cell in Fig. 4). F, Time point-by-time point comparison of recorded and reconstructed Vm shows excellent agreement across many levels of current injection, with a root mean square (RMS) error of 1.95 mV. G, Left, A stimulus of dark pixels (outlined in dashed line) was hand plotted on-line to remain well inside the OFF subregion of the cell in A–D. Right, Vrev, gSyn, gE, and gI in response to this stimulus.
