Figure 4.
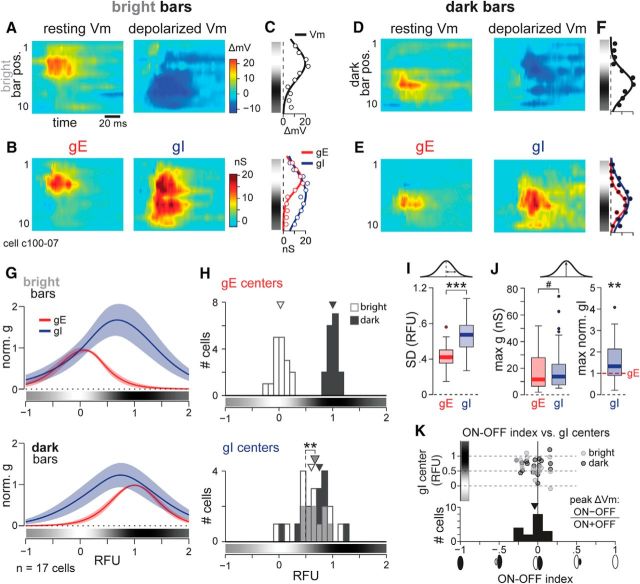
Inhibition is broad across the simple cell RF. A, Vm responses at rest (left, Vrest = −78 mV) and with depolarizing current (right, Vrest = −41 mV) of an example simple cell in response to bright bars. Peak depolarization from rest (left) to a bright bar in position 4 was 19.7 mV. B, Left, gE responses to bright stimuli were strictly constrained in space, coinciding with the ON subregions. Right, Bright stimuli evoked strong gI across the width of the RF. C, Gaussian fits of peak resting Vm (top) and gE and gI (bottom) responses to bright bars. Lines are fits; points are data values. Grayscale colorbar representation of the RF shown to the left of each plot was generated from Vm responses as in Figure 1. D–F, as in A–C, but responses to dark bars in the same cell. Peak depolarization from rest (D, left) to a dark bar in position 7 was 22.1 mV. G, Mean ± 95% confidence interval of normalized Gaussian fits of gE (red) and gI (blue) responses to bright (top) and dark (bottom) stimuli, n = 17 cells. The average 1D RF from Vm responses is shown below each plot. Note that 0 and 1 RFU are defined for each cell as the centers of the ON and OFF subregions, respectively. H, Top, Distributions of the centers of gE responses to bright and dark are segregated by RF subregion (n = 17 cells). Bottom, Distributions of the center of gI responses to bright and dark are overlapping. Gray bins show an overlap of the two distributions. Medians are indicated by arrowheads. Centers of all gI responses (median, gray arrowhead) are closer to the OFF than the ON subregions. I, gI responses are broader than gE responses, quantified as SDs of Gaussian fits. J, Left, Absolute values of maximum gE and gI are not quite significantly different for p < 0.05. Right, When normalized to maximum gE for each cell and contrast, the maximum gI is on average 1.3 times greater than gE (dashed red line at 1). K Top, Scatter plot of ON–OFF index versus the centers of gI distributions to bright and dark stimuli. Bottom, The distribution of ON–OFF indices spans zero. Arrowhead indicates median. #p < 0.06; **p < 0.01; ***p < 0.001.

