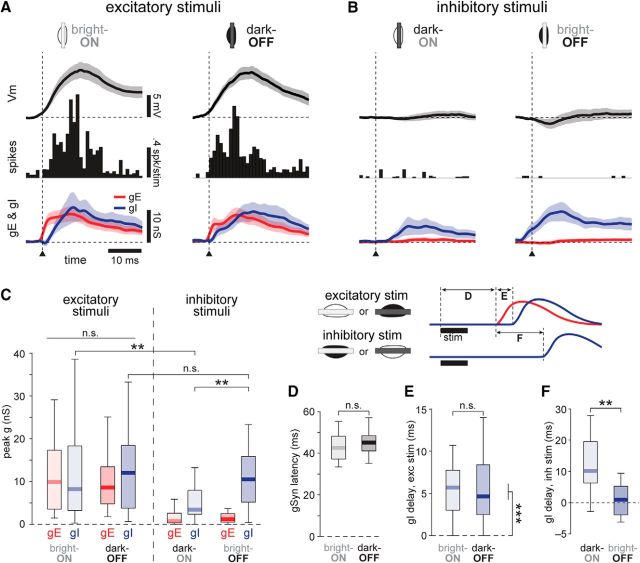
Figure 6.
Dynamics of conductances from stimuli at RF subregion centers. A, Responses to excitatory stimuli. Left column, Bright bars in ON subregions; right column, dark bars in OFF subregions. Top row, mean ± 95% confidence interval of ΔVm from rest. Middle row, Average PSTH from cells recorded without QX-314. Bottom row, average estimated gE (red) and gI (blue) underlying the Vm and spiking responses. Arrowhead and vertical dashed line indicate synaptic response onset, to which responses were aligned before averaging. ON subregions: Vm and conductances, n = 30; spikes, n = 19. OFF subregions: Vm and conductances, n = 26; spikes, n = 17. B, Same as A, but for inhibitory stimuli: dark bars in ON (left) and bright bars in OFF (right) subregions. Note that the onset time for these plots is derived from the response onset to the corresponding excitatory stimulus in the same subregion (A). Differences in relative response times of gI are quantified in F. C, Peak conductances from the data in A and B. There were no differences between peak gE and gI for ON and OFF subregions (all p values >0.025 significance level corrected for multiple comparisons). Peak dark-ON gI was less than bright-OFF gI, and also was less than bright-ON gI. Outliers are not shown in boxplots. D–F, Latencies of conductances, measured as illustrated in the inset above. Outliers not shown in boxplots. D, Onset latency of the synaptic response for ON and OFF subregions. E, For excitatory stimuli, onset delay between gE and gI was significant, but did not differ between ON and OFF subregions. F, For inhibitory stimuli, onset delay of gI, measured relative to gE onset from an excitatory stimulus in the adjacent subregion, was greater for dark bars than bright bars, n = 22. **p < 0.01; ***p < 0.001.

