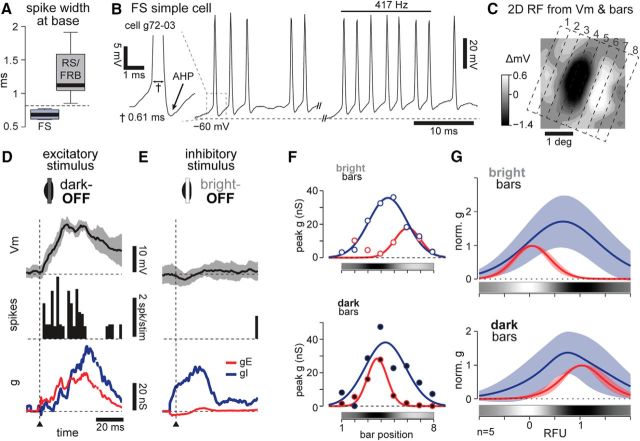
Figure 8.
FS cell RFs are indistinguishable from RS cells. A, Average width at spike base for the n = 5 FS cells and n = 11 RS and FRB cells used for comparisons in this figure. Dashed line at 0.8 ms cleanly divides the two groups. B, Spiking response examples from an FS cell. Left inset, Thin spike (0.6 ms at base) and large afterhyperpolarization (AHP). Right, Bursts of high-frequency, nonadapting spikes in response to visual stimuli. C, 2D RF and bars (dotted lines) used as 1D stimuli. D, Vm (mean ± 95% confidence interval from 6 trials), spiking, and conductance responses to a dark excitatory stimulus in the OFF subregion of the cell from B, as in Figure 5B. Vrest = −75 mV. E, As in D, responses to a bright inhibitory stimulus in the same OFF subregion. F, Peak gE and gI responses to bright and dark stimuli across the RF, as in Figure 4. 1D colorbars show subregions defined by the Vm. G, Average gE and gI fit responses over space for 5 FS cells in our dataset.

