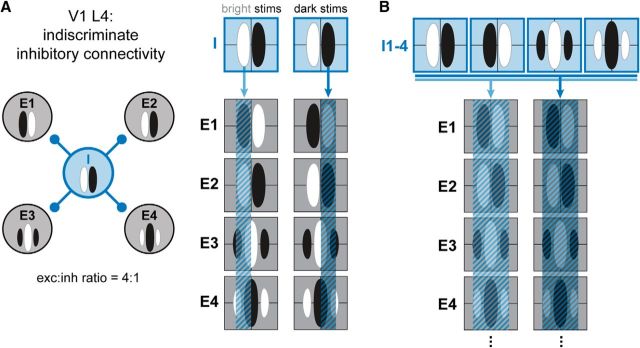
Figure 9.
Schematic of indiscriminate inhibitory connectivity. A, Left, Wiring diagram of a single inhibitory cell (I; blue) synaptically connected to four excitatory cells (E1–E4, black). Anatomy suggests that inhibitory cells in V1 L4 are indiscriminately connected to cells within 150 μm of their cell bodies. Right, 2D RFs of all 5 cells, overlaid with the footprint of inhibition imposed by the inhibitory cell in response to bright (left) and dark (right) stimuli. The distribution of inhibition from this single inhibitory cell on each excitatory cell has no spatial correlation with the RF of the postsynaptic cell. B, When multiple inhibitory cells with different RFs (I1–I4) project to the same set of excitatory cells, the summed footprints of the inhibitory output cover the RF of each postsynaptic cell, generating broad inhibition.

