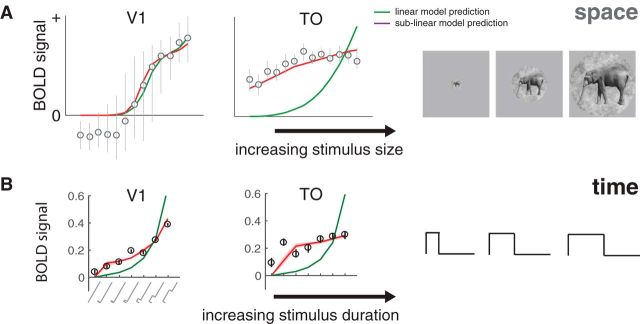
Figure 13.
Subadditive spatial and temporal summation. A, BOLD responses pooled across voxels in V1 (left) and in TO (right) are plotted as a function of stimulus size. Circles and error bars represent means and SEs across bootstrapped estimates. A compressive spatial summation model (red), fit to separate data, predicts the responses slightly more accurately than a linear model (green) in V1, and substantially more accurately in TO. Adapted with permission from Kay et al. (2013a, their Fig. 8). B, A similar pattern is observed for duration, replotted from Figure 4A.

