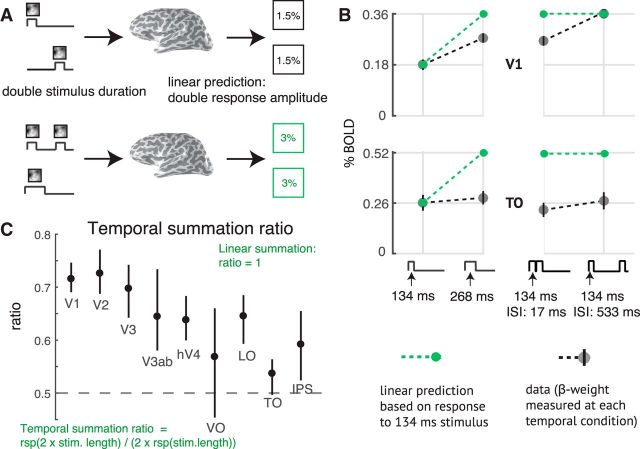
Figure 3.
Sublinear temporal summation in visual cortex. A, Linear temporal summation prediction. The sum of the responses to two separate events (top) is equal to the response to the two events in the same trial, with or without a brief gap between them (bottom). B, Sublinear temporal summation. Gray circles represent the measured responses to a 134 ms pulse, a 268 ms pulse, and two 134 ms pulses, with either a 17 or 134 ms gap between pulses. Plots represent the mean across participants and 50% CI (bootstrapped across repeated scans within each participant). Green circles and dotted lines represent the linear prediction based on the response to the single 134 ms pulse. For V1, the measured responses are less than the linear prediction, except when there is a long gap. For area TO, all responses are less than the linear prediction. C, Temporal summation ratio. Temporal summation ratio is the response to a stimulus of length 2x divided by twice the response to a single pulse stimulus of length x, averaged across 5 stimulus pairs (17 and 34 ms, 34 and 68 ms, etc). Linear summation occurs when the temporal summation ratio is 1. The temporal summation ratio is <1 in all visual areas, indicating compressive temporal summation. The ratio is higher in early visual areas (∼0.7 in V1–V3) and lower in later areas (∼0.5 to 0.65). Error bars indicate the 50% CI (bootstrapped across scans). The ROIs on the x-axis are arranged in order of increasing spatial pRF size at 5 degrees eccentricity, as a proxy for order in the visual hierarchy. Figure made from the script trf_mkFigure3.m.

