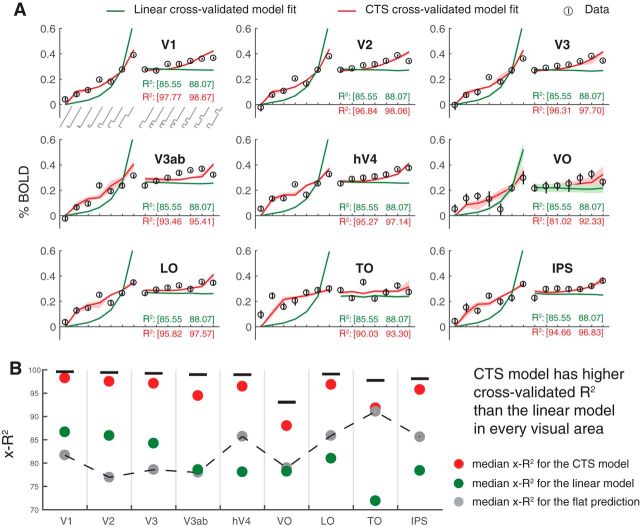
Figure 5.
CTS model fits to BOLD data across visual areas. A, Data and predictions. Circles represent BOLD responses to each temporal condition averaged across participants. The temporal conditions on the x-axis show increasing durations of one-pulse stimuli (0 to 533 ms; left) and increasing ISI of two-pulse stimuli (0 to 533 ms, right). Stimulus temporal conditions are as in Figure 2A. Error bars indicate the 50% CI bootstrapped across repeated scans. Predictions for the linear (green) and CTS (red) model fits are computed by leave-out-one-condition cross-validation. Shaded regions represent the 50% CI of the predictions across bootstraps (not visible for most of the linear fit because the CI is narrow). B, The cross-validated accuracy (x-R2) is higher for the CTS model, compared with the linear model in each area. Each circle represents the median cross-validated R2 for each model. Error bar indicates the 50% CI across bootstraps. Figure made from the script trf_mkFigure5.m.

