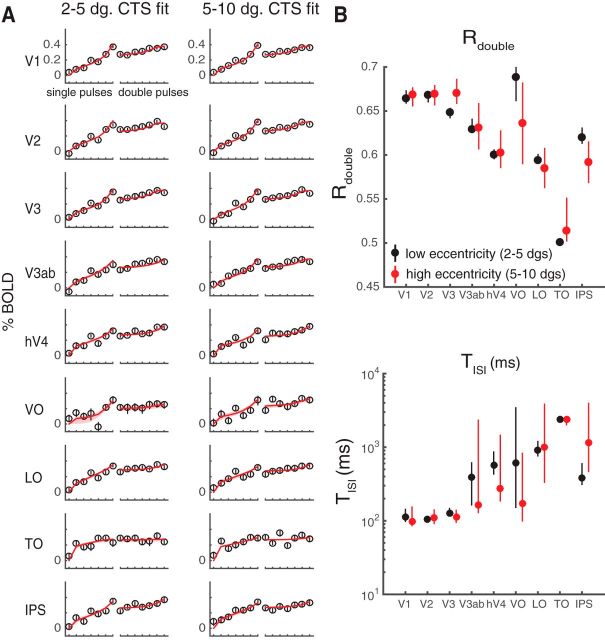
Figure 7.
CTS model fits by eccentricity. Data from the main fMRI experiment are replotted, separating each ROI into two eccentricity bins. A, CTS model fit to low and high eccentricity bins. Left panels, Data and CTS model fits restricted to voxels with pRF centers within 2°–5°. Right panels, Data and CTS model fits restricted to voxels within 5°–10° eccentricity. B, Summarized metrics for different eccentricity bins. The summarized metrics do not differ systematically between the two eccentricity ranges. Each dot indicates the median of the metrics summarized for 100 bootstraps of data (across scans). Error bars indicate 50% CI. Figure made from the script trf_mkFigure7.m.

