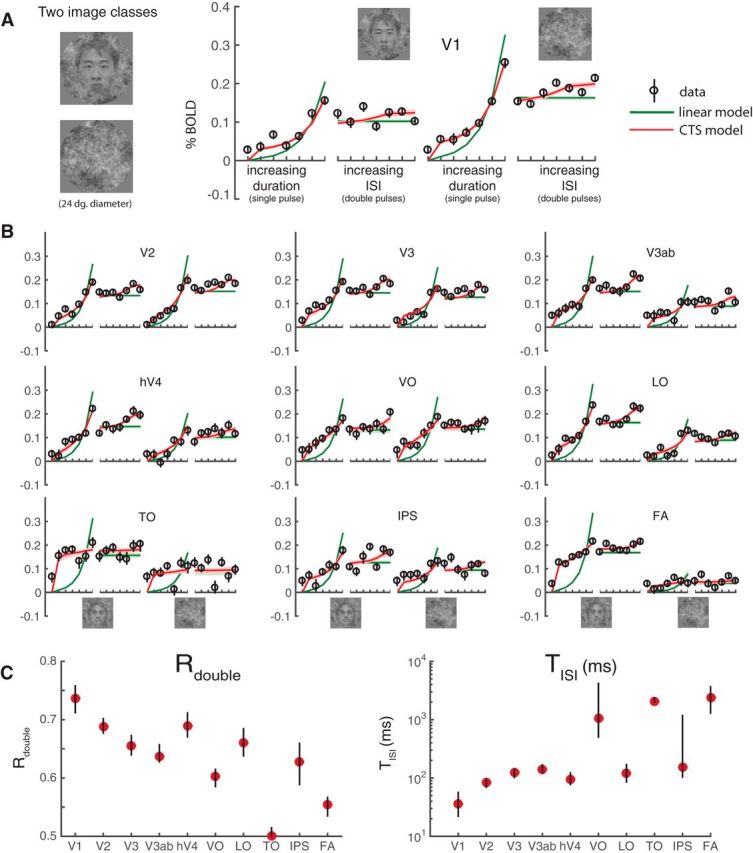
Figure 8.

fMRI data and model fits from a second experiment. A, Stimuli and V1 responses. The two stimulus classes (noise patterns and faces embedded in noise patterns) were randomly interleaved within runs. Temporal conditions were identical to those in Figure 4. The general pattern of responses and model fits are highly similar to those in the main experiment, with the CTS model fitting the data much more accurately than the linear model. B, CTS model fit to extrastriate visual areas. The CTS model (red) fit the data more accurately than the linear model in all visual areas. C, Parameters derived using the CTS model fit. The derived metrics, Rdouble and TISI, show similar patterns as in the main experiment: decreased Rdouble and increased TISI in higher visual areas. Figure made from the script trf_mkFigure8.m.
