Figure 1.

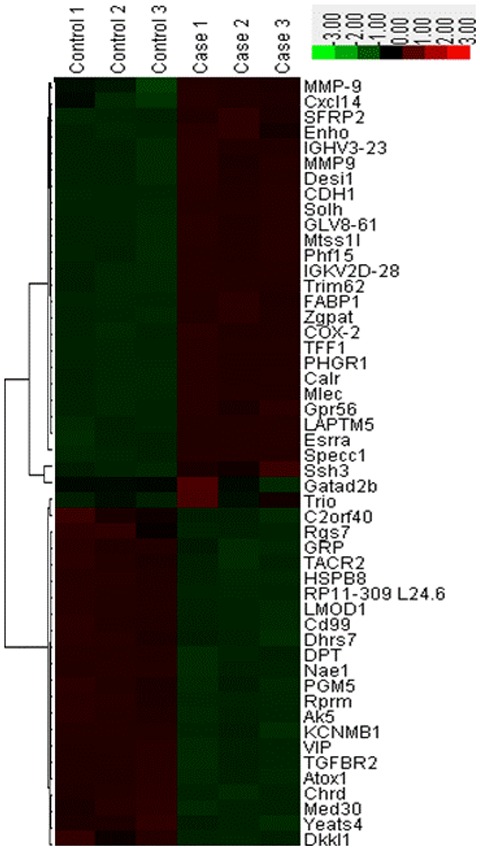
Heat map and cluster analysis of the 50 differentially expressed mRNAs in control and gastric cancer tissue samples. Red represents high relative expression levels; Green represents low relative expression levels.

Heat map and cluster analysis of the 50 differentially expressed mRNAs in control and gastric cancer tissue samples. Red represents high relative expression levels; Green represents low relative expression levels.