
Figure 1.
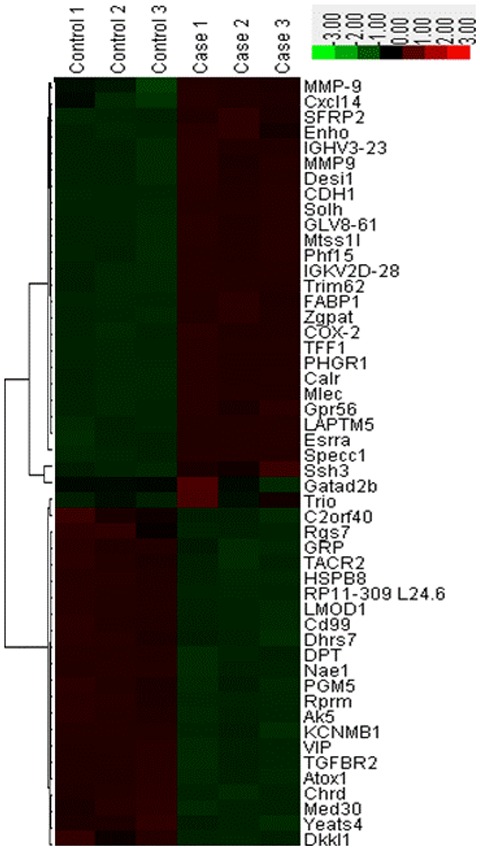
Heat map and cluster analysis of the 50 differentially expressed mRNAs in control and gastric cancer tissue samples. Red represents high relative expression levels; Green represents low relative expression levels.
Official websites use .gov
A
.gov website belongs to an official
government organization in the United States.
Secure .gov websites use HTTPS
A lock (
) or https:// means you've safely
connected to the .gov website. Share sensitive
information only on official, secure websites.
Heat map and cluster analysis of the 50 differentially expressed mRNAs in control and gastric cancer tissue samples. Red represents high relative expression levels; Green represents low relative expression levels.