Figure 1.
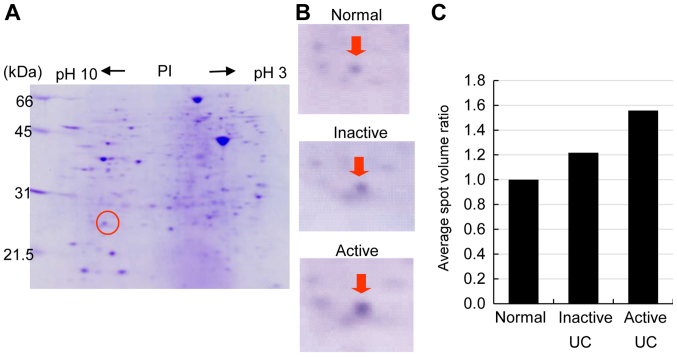
Agarose-2DE gel patterns of active ulcerative colitis sigmoid colon biopsies in Coomassie blue-stained two-dimensional electrophoresis gels. (A) Representative proteomic maps derived from active UC sigmoid colon biopsies. (B) Detailed gel images show PRDX1 expression in the normal mucosa, inactive UC, and active UC. (C) Average spot volume retio of PRDX1 in sigmoid colon biopsies. Active UC shows the highest PRDX1 expression compared with levels in inactive UC and normal mucosa. PI: Isoelectric point.

