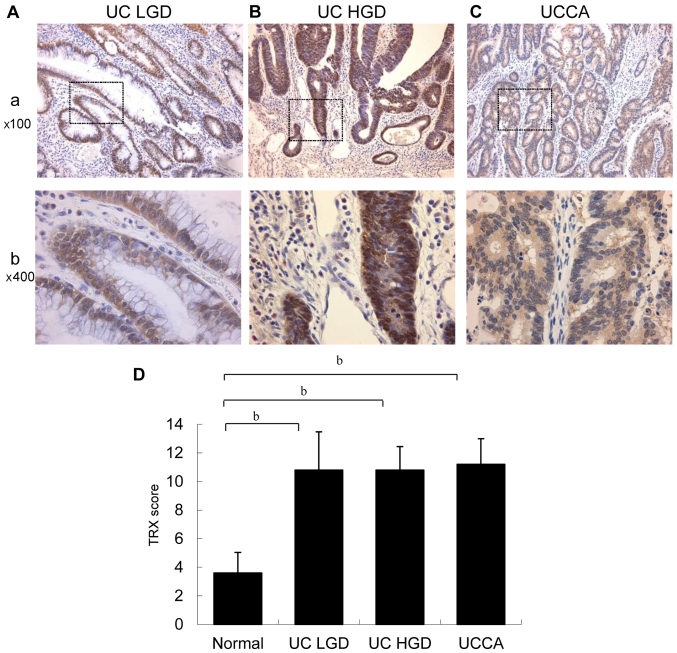
Figure 8.
Immunohistochemical staining for TRX expression in UC-associated neoplastic lesions. (A) UC LGD, UC low-grade dysplasia. (B) UC HGD, UC high-grade dysplasia. (C) UCCA, UC-associated carcinoma. (a) Low magnification (×100). (b) A higher magnification (×400) of the boxed area in panel (a) is shown. (D) The epithelial expression of TRX in UC-associated neoplastic lesions. Data are shown as mean scores ± standard deviations. bP<0.01.

