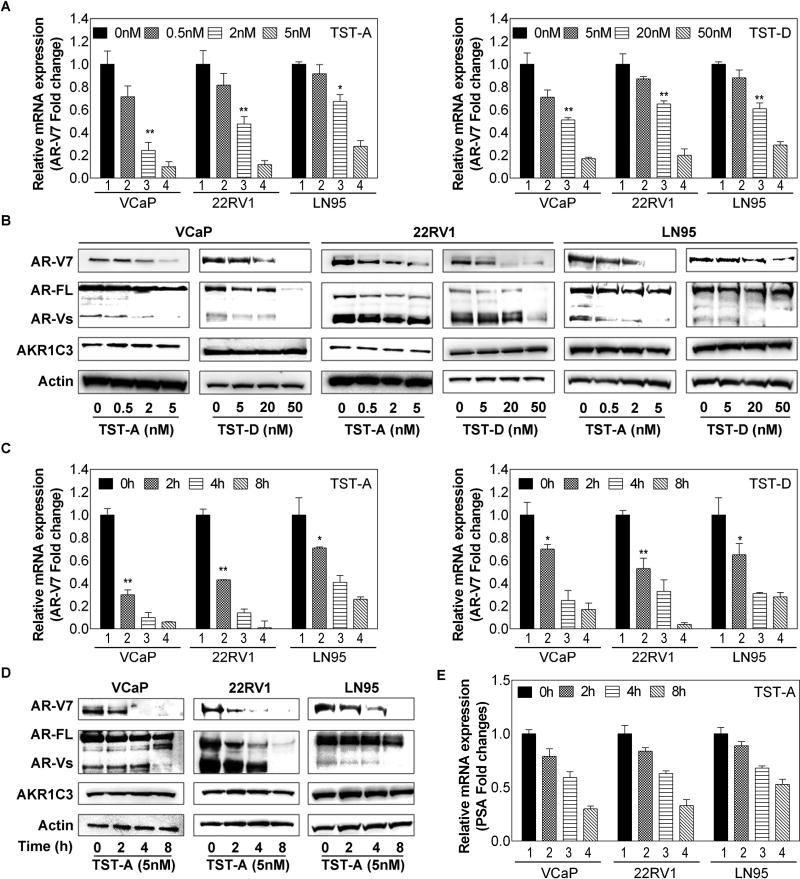
Figure 2. The effect of TSTs on AR gene expression in CRPC cell lines.
Cells were treated with TST-A at 0, 0.5, 2, 5 nM (A) or TST-D at 0, 5, 20, 50 nM (B) for 4 hours, total cellular RNA and cell lysates were prepared and subjected to western blot and qRT-PCR analyses. The relative AR-V7 mRNA expression from each treatment was normalized with 18S rRNA then calculated using control (=1). Cells were treated with 5 nM TST-A or 50 nM TST-D, cell pellets were collected 0, 2, 4, 8 hours after treatment. Total cellular RNA and cell lysates were prepared and subjected to qRT-PCR analyses (C) or western blot (D).

