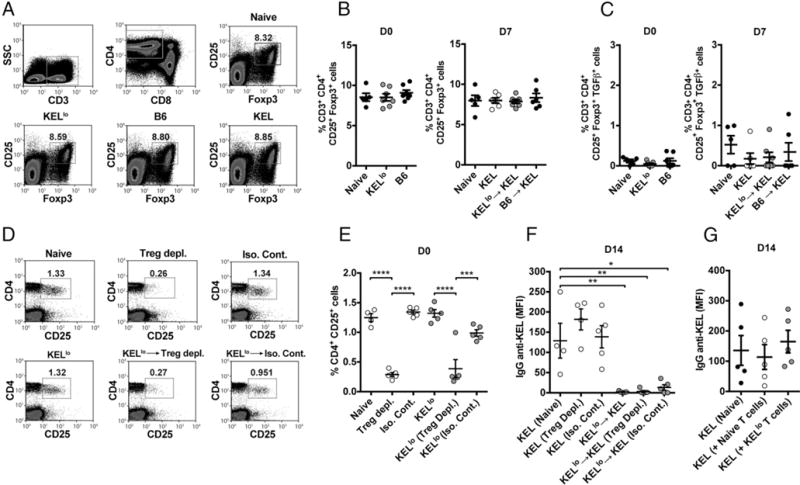
FIGURE 5.

KELlo RBC exposure fails to induce detectable changes in Treg numbers or function. (A) Representative flow plots of CD25+ Foxp3+ Tregs following C57BL/6 KEL− recipient exposure to PBS (Naive), C57BL/6 (B6), KELlo, or KEL RBCs. Quantitative analysis of CD25+ Foxp3+ Tregs (B) or quantitation of TGF-β–producing CD25+ Foxp3+ Tregs (C) following exposure to C57BL/6 (B6) or KELlo RBCs prior to (D0, day 0) or following (D7, day 7 following transfer) a KEL RBC challenge. A PBS-treated control group, not exposed to KEL (Naive), was also evaluated at each time point. At D7, a group transfused with KEL only group (KEL) was included to control for endogenous Treg response to KEL RBC exposure. (D) Representative flow cytometric examination of CD4+ CD25+ T cells following injection of an anti-CD25 depleting or isotype-control Ab. (E) Quantitative analysis of CD4+ CD25+ T cells following depletion (Treg depl.) or isotype control (Iso. Cont.) injection, as indicated. (F) Examination of IgG anti-KEL Ab formation following KEL RBC transfusion (KEL) into untreated (Naive), CD4+ CD25+ T cell–depleted (Treg Depl.), or isotype control (Iso. Cont.)-treated recipients or recipients that were exposed to KELlo RBCs prior to depletion of CD4+ CD25+ T cell depletion (Treg Depl.) or isotype control (Iso. Cont.) treatment and then challenged with KEL RBCs (KELlo→KEL). (G) Evaluation of anti-KEL IgG Ab formation following KEL RBC challenge in recipients pretransfused with PBS (Naive) or adoptively transferred with 107 CD4+ T cells from C57BL/6 naive (Naive T cells) or KELlo RBC–treated (KELlo T cells) recipients. Error bars indicate SEM. *p < 0.05, **p < 0.01, ***p < 0.001, ****p < 0.0001, one-way ANOVA.
