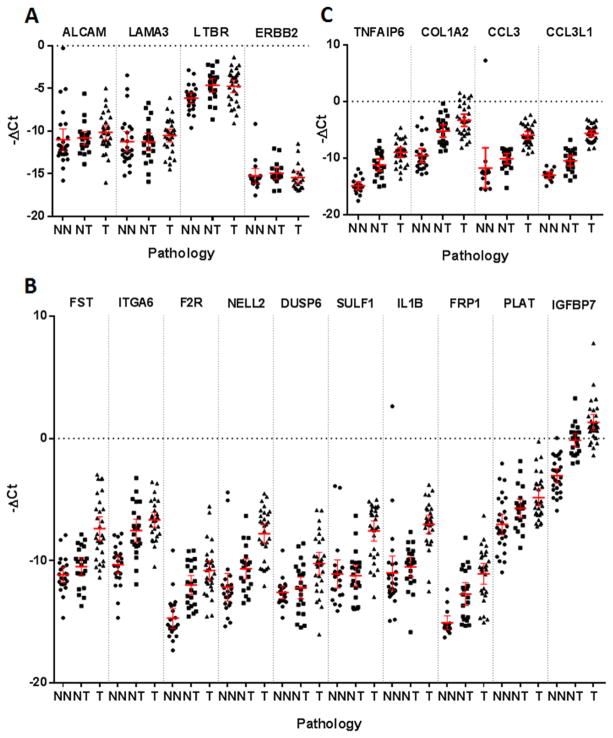
Figure 2.
−ΔCt qPCR data relative to housekeepers β-actin and RPS18 from normal esophagus (NN), normal esophagus from ESCC patients (NT) and ESCC (T) samples. The mean and 95% confidence intervals are displayed. A: Genes with no statistical difference in expression between sample groups. B: Genes which showed significant overlap in expression between sample groups. C: Genes with less clear separation compared to their analogous gene counterparts.

