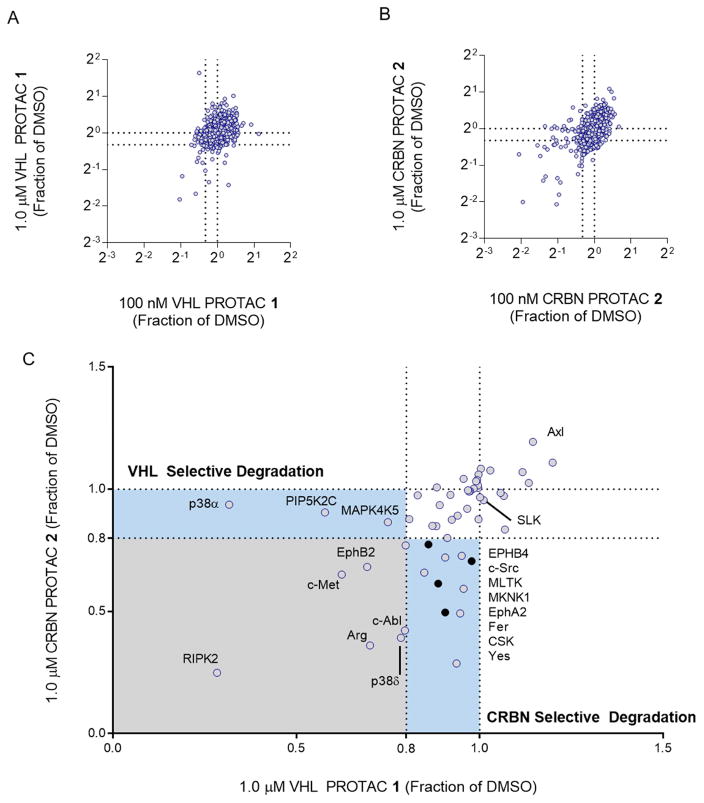
Figure 2. Foretinib-based PROTACs degrade only a subset of foretinib-binding kinases.
(A) Multiplexed tandem mass spectrometry was used to assess global changes in the proteome of MDA-MB-231 cells after treatment with VHL PROTAC 1. After 24 hours with either 100 nM (plotted on the X-axis) or 1 μM (Y-axis) of 1, proteins were extracted from cells, labeled with tandem mass tags, and then 7,826 unique proteins were quantified according to the STAR methods section. The values plotted are fractions of the vehicle (DMSO) control. Dotted lines at 0.8 indicate the cut-off for a protein to be degraded. (B) Same as in (A), for CRBN PROTAC 2. (C) Comparison of proteomic changes after treatment with compounds 1 or 2. Fraction of DMSO after treatment with 1 μM VHL PROTAC 1 (X-Axis) or CRBN PROTAC 2 (Y-axis) are compared for each of the 54 foretinib-binding kinases. Dotted lines indicate the 80% cutoff for degradation, and areas of selectivity for 1 or 2 are highlighted. The light blue dots indicate proteins that are degraded in PROTAC treatment and in the control compounds, and so are not classified as bona fide PROTAC targets.

