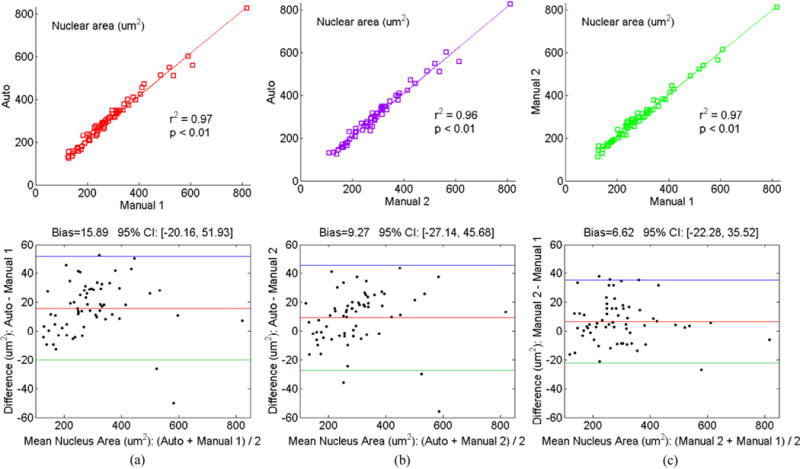
Fig. 10.

Statistical correlation analysis and Bland–Altman plots between (a) automated (our graph-search) method and Manual 1 segmentation, (b) automated (our graph-search) method and Manual 2 segmentation, and (c) Manual 2 and Manual 1 segmentation on abnormal cervical nuclei from HEMLBC dataset (Zhang et al., 2014b).
