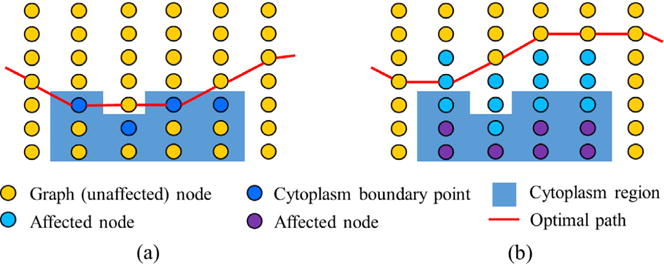
Fig. 5.

The illustration of the context prior constraints. (a) The optimal path passes through cytoplasm boundary points. (b) Incorporation of context prior constraints. Affected nodes above and below the cytoplasm boundary are modified by context prior penalties and hard context constraints, respectively. (For interpretation of the references to color in the text, the reader is referred to the web version of the article.)
