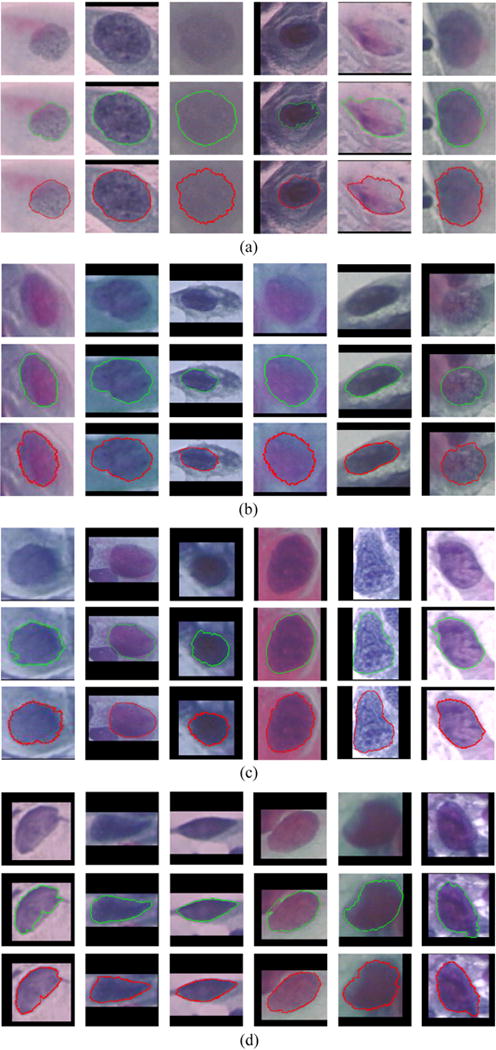
Fig. 8.

Examples of our graph-search based segmentations on (a) mild dysplasia, (b) moderate dysplasia, (c) severe dysplasia, and (d) carcinoma cervical nuclei from the Herlev dataset (Jantzen et al., 2005). In each sub-figure ((a)–(d)), from the first to the third rows are original image, ground truth (green boundaries), and our segmentation results (red boundaries), respectively. (For interpretation of the references to color in this figure legend, the reader is referred to the web version of the article.)
