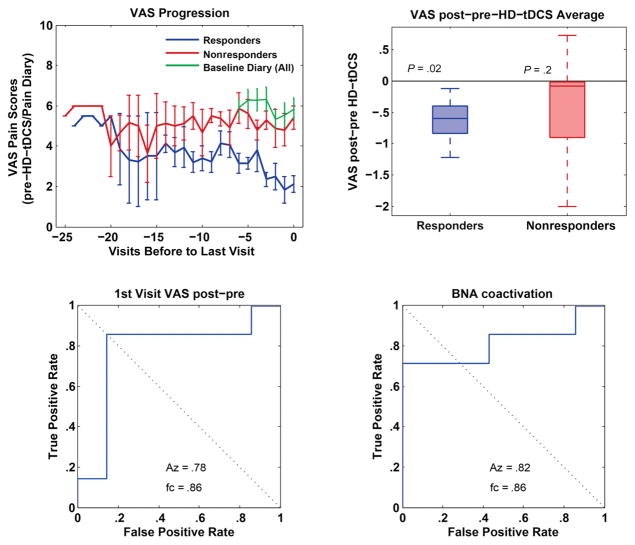
Figure 6.
(Top left) Because there were no interactions between time and response, to visualize cumulative effects of treatment between responders and nonresponders, we displayed VAS scores aligned to the last day of treatment. (Top right) Determination of an acute effect between responders and nonresponders by averaging VAS scores before and after HD-tDCS treatment, across all sessions. Here, responders show a significant acute decrease in VAS compared with nonresponders. (Bottom left) ROC analysis examining the acute effect observed on the first treatment day, showing that it is a reasonable predictor of treatment success. (Bottom right) ROC analysis on the BNA scores from the pretreatment session showing that responsiveness can be predicted before the commencement of treatment. All pairwise comparisons between responders and nonresponders used the Wilcoxon rank sum test with N = 14 measures.

