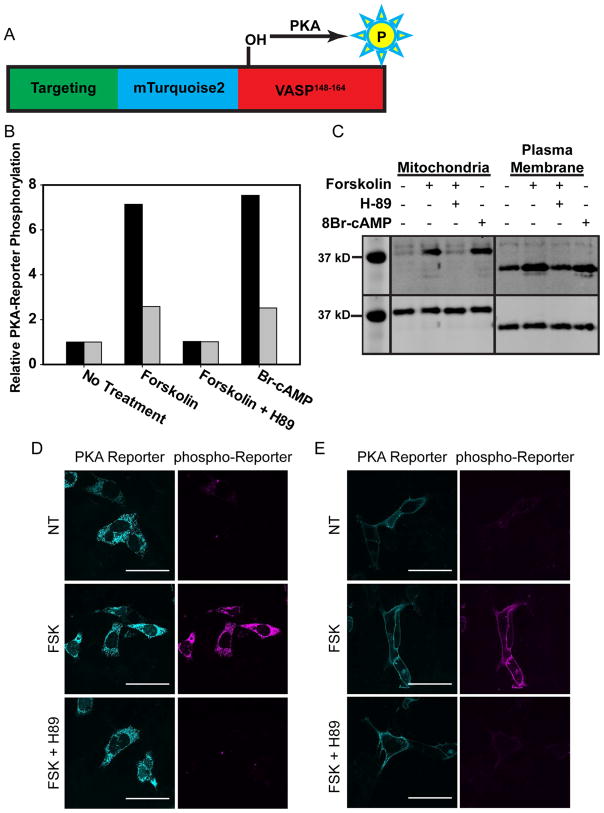
Figure 3. Validation of Intracellular PKA-Reporter Localization.
(A) Schematic of PKA-Reporter architecture, where the targeting sequence (green) positions the PKA-Reporter at specific intracellular sites, mTq2 (blue) offers a visual confirmation of intracellular placement, VASP148–164 (red) is phosphorylated by PKA, and phospho-VASP148–164 (yellow) is recognized by a commercially available antibody (and a secondary antibody containing Alexa 647). (B, C) Endogenous PKA was activated via treatment of MVD7 cells with forskolin (activates adenylate cyclase, which produces cAMP) or Br-cAMP (a cell permeable analog of cAMP). Cells were lysed after treatment and the extent of PKA-Reporter phosphorylation quantified via Western blot using a phospho-VASP antibody. (B) Quantification of PKA-Reporter phosphorylation at the OMM (black) or the PM (grey) in response to forskolin or Br-cAMP. Changes in PKA-Reporter phosphorylation levels are defined as relative to untreated cells. (C) Western blot of phosphorylated PKA-Reporter targeted to either the OMM or the PM as a function of various treatment protocols: (top) The dynamic range of the PKA-Reporter at the OMM (7-fold) is greater than that of the PKA-Reporter at the PM (2-fold). The reduced dynamic range of the latter is due to higher levels of PM phosphorylated PKA-Reporter in untreated cells. This may be a consequence of more robust endogenous PM PKA activity and/or reduced PM protein phosphatase activity relative to that at the OMM. (bottom) Staining of the HA tag on the PKA-Reporter was used to assess total PKA-Reporter levels (Note: only the region of the Western blot that contains the bands of interest is shown. The rest of the blot has been cropped for clarity). (D, E) Validation of the PKA-Reporter, with representative images for experiments conducted at the OMM and PM in MVD7 cells. Left panels display the OMM or PM-localized PKA-reporter (mTq2) and middle panels display the presence/absence of phosphorylated-reporter (using a pVASP antibody). There is no PKA-Reporter phosphorylation (D, E) in the absence of PKA activation, but extensive PKA-Reporter phosphorylation (D, E) upon treatment with 100 μM forskolin. Finally, (D, E) PKA-Reporter phosphorylation is not observed in cells exposed to both forskolin and a PKA inhibitor (H89). Scale bar = 50 μm.

