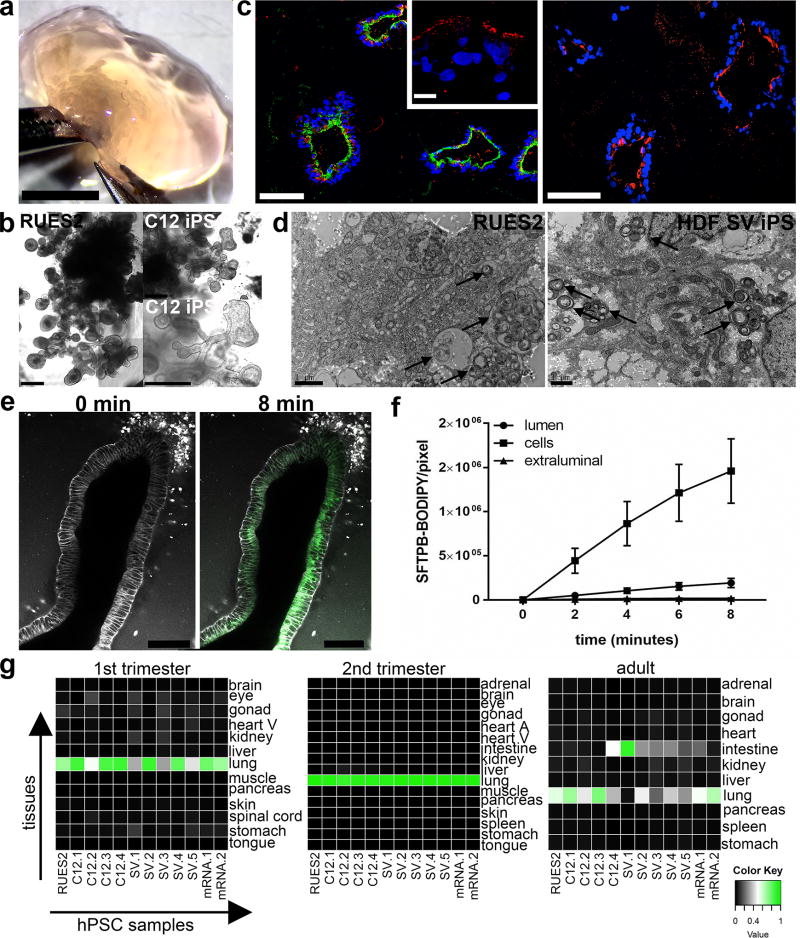
Figure 4. Long-term development of LBOs in vitro.
(a) Macroscopic appearance of d170 RUES2 LBOs embedded in Matrigel at d25. Representative of >50 independent experiments. Scale bar 5 mm. (b) Bright field images of d170 RUES2 and C12 LBOs embedded in Matrigel at d25. Representative of >50 independent experiments. Scale bars 500 µm. (c) Immunofluorescence for indicated markers in d170 RUES2 LBOs embedded in Matrigel at d25. Representative of 3 independent experiments. Scale bars for MUC1+SFTPB and HT2-280 100 µm. Scale bar for SFTPC 10 µm. (d) Electron microscopy of d170 LBOs embedded in Matrigel at d25 in RUES2 ESCs and HDF SV iPSCs. Arrows indicate LBs. Representative of 3 independent experiments. (e) Uptake of SFTPB-BODIPY (green) in d170 LBOs embedded in Matrigel at d25. Representative of 4 independent experiments. Scale bars 100 µm. (f) Time-course of uptake of SFTPB-BODIPY in d170 LBOs embedded in Matrigel at d25 (mean±s.e.m, n=4 independent experiments in RUES2 ESCs). The source data can be found in Supplementary Table 4. (g) Comparison of genome-wide expression in d170 LBOs derived from hESCs and hiPSCs (12 biologically independent samples) with the KeyGenes database, showing the best match with second trimester human lung.

