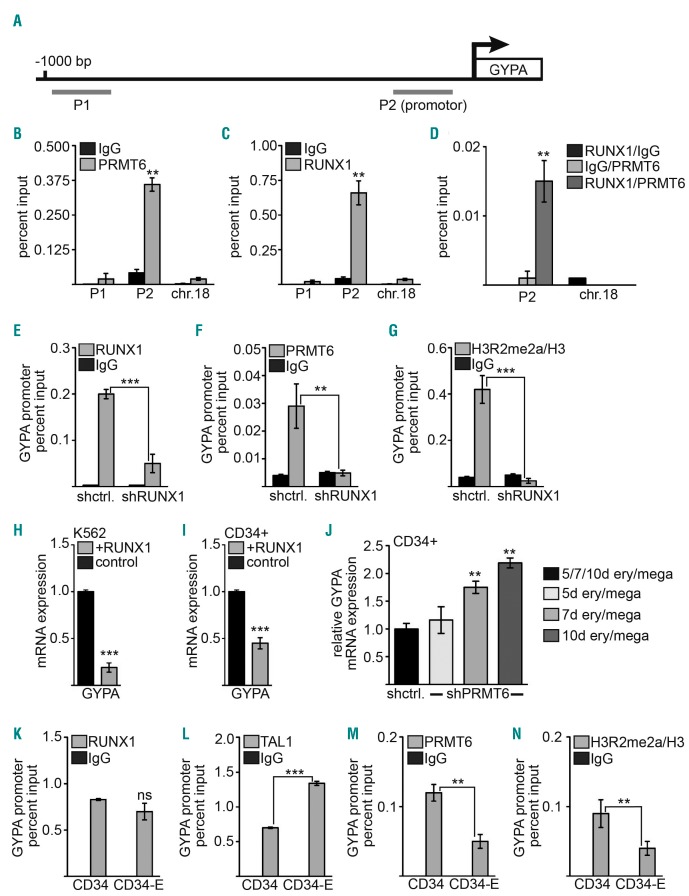
Figure 4.
GYPA is a direct target of hematopoietic transcription factors and PRMT6. (A) Scheme of the GYPA promoter showing the position of the ChIP-primers. (B) ChIP with K562 cells indicates binding of PRMT6 to the promoter region of GYPA (P2) but not to an upstream region (P1) or an unrelated control region (chr.18). (C) RUNX1 binds to the promotor region (P2) of GYPA but not to an upstream region (P1) or an unrelated control region on chromosome 18 (chr.18). (D) Quantitative ChIP-ReChIP of RUNX1 and PRMT6 with the given antibody combinations shows co-occupancy of RUNX1 with PRMT6 at the GYPA promoter (left) but not at a control region (chr.18) in K562 cells. (E, F) ChIP assay after RUNX1 knockdown shows reduced RUNX1 and PRMT6 binding to the GYPA promoter. (G) H3R2me2a modification at the GYPA promoter is decreased upon RUNX1 knockdown. (H, I) RUNX1 overexpression decreased GYPA mRNA expression in K562 and CD34+ cells measured by quantitative reverse transcriptase PCR. (J) Knockdown of PRMT6 in CD34+ cells cultured in ery/mega medium results in increased GYPA mRNA expression with time. The GYPA expression level of the corresponding time point was set as one. (K–N) Changes at the GYPA promoter upon erythroid differentiation of CD34+ cells. (K) RUNX1 binding to the GYPA promoter remains unchanged upon erythroid differentiation. (L) TAL1 binding to the GYPA promoter is increased upon erythroid differentiation. (M) PRMT6 binding is reduced upon erythroid differentiation. (N) Upon erythroid differentiation the repressive H3R2me2a modification at the GYPA promoter is decreased. Note that in K–N the values for IgG are small, so that the bar for the IgG control is not visible. Quantitative ChIP-PCR values are shown as percentage input. Values gathered for histone modification H3R2me2a were normalized with a ChIP against unmodified histone H3. Error bars show the standard deviation from at least four independent evaluations. The P-values were calculated using the Student t-test. *P<0.05; **P<0.01; ***P<0.001.

